Stop Churn: Account Health Scoring for CSMs With 5–8 Signals

An account health score is a per-account 0-100 composite that tells customer success managers which customers to contact now and which playbook to run. It rolls up usage, adoption, support, billing, and sentiment data into one number, updated on a regular cadence, so CSMs stop guessing and start prioritizing. The score only earns its keep when tiers map directly to actions in the CRM.
TL;DR:
- Usage signals, like login frequency decline, are the most reliable early warning indicators of potential churn, often preceding 68% of churn events.
- Weights for scoring typically allocate 30% to usage, 25% to adoption, 20% to support, 15% to billing, and 10% to NPS, with tiers triggering specific CSM actions.
- Scores should be updated weekly, combining fast-moving signals with lagging ones like billing, and validated regularly against actual outcomes to improve accuracy.
- Hard overrides are essential to prevent critical issues such as failed payments from being masked by overall positive scores.
- Embedding scores directly into CRM workflows and automating alerts or playbooks ensures timely, actionable response, boosting retention outcomes.
Table of Contents
- What Is Account Health Scoring?
- Why Account Health Scoring Matters for Retention
- Which Signals Should Feed an Account Health Score?
- How Do You Calculate an Account Health Score?
- What Weights and Thresholds Should You Use?
- How Do You Validate and Recalibrate a Health Score?
- How Do You Operationalize Health Scores in CRM Workflows?
- Worked Example and Sample Playbook Templates
- Who Builds and Trusts These Scores, and Why It Works
- What CS Leaders Get Wrong About Health Scoring
- Put Account Health Scoring on Autopilot
- Sources
- FAQ
What Is Account Health Scoring?
Account health scoring measures a single customer’s trajectory toward renewal, expansion, or churn. It differs sharply from portfolio-level diagnostics, which look across an entire book of business to spot systemic issues like a bad onboarding cohort or a pricing tier that churns disproportionately. A health score, by contrast, is granular: one number, one account, updated weekly in most mature programs.
The typical scale runs 0 to 100, though some teams use letter grades or four color tiers layered on top of the number. What the score predicts is narrow and specific: the likelihood that an account renews, expands, or churns within the next 30 to 90 days. What it does not do is diagnose root cause on its own. A score of 42 tells you an account is at risk; it takes drill-down into the underlying subscores, usage trend, ticket volume, and so on, to tell you why.
That distinction matters for how teams build trust in the metric. A CSM who sees a dropping score without visibility into the driver behind it will eventually stop checking the dashboard.
Why Account Health Scoring Matters for Retention
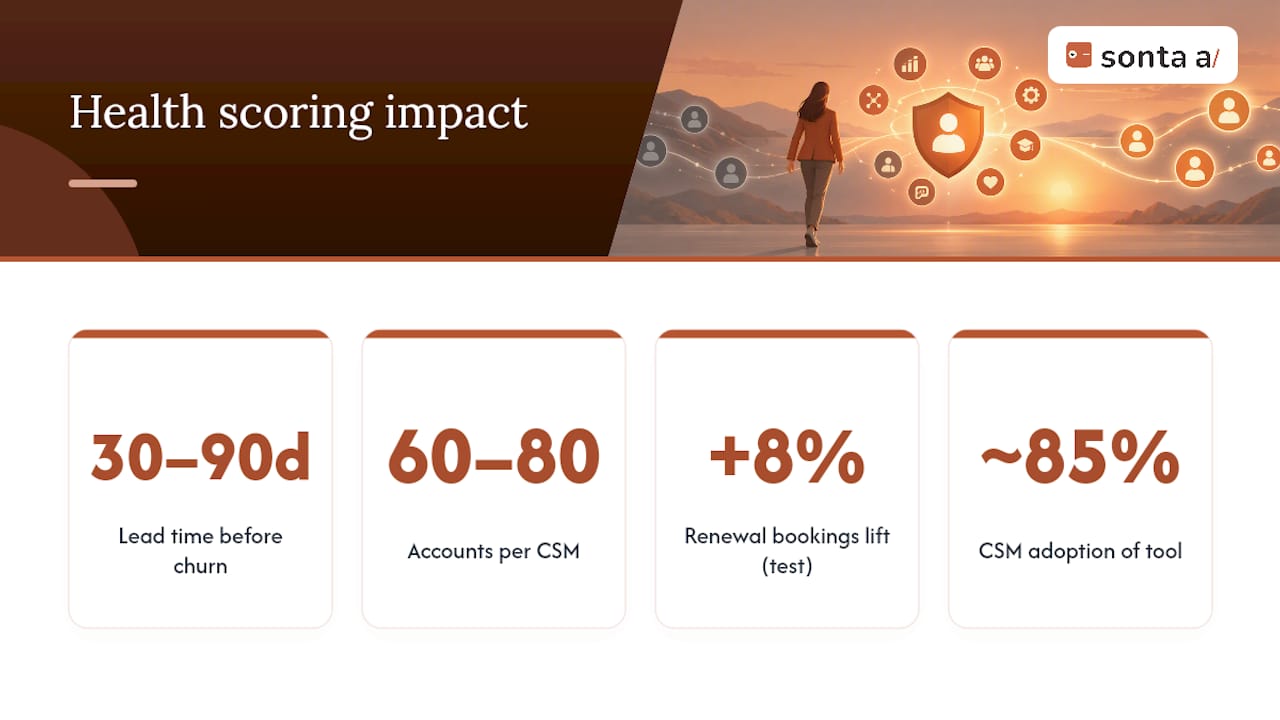
The value of health scoring comes down to lead time. Most churn does not happen suddenly. It builds over 30 to 90 days of declining usage, unresolved support tickets, or silence from a champion who left the company. That window is the entire point of the exercise: it is the gap between a warning sign and a lost renewal, and it is the only period during which a CSM’s outreach can actually change the outcome.
Health scores also solve a resourcing problem every CS team faces. A CSM managing 60 or 80 accounts cannot personally monitor every login trend and ticket queue. A composite score directs limited attention toward the accounts that actually move revenue, rather than the accounts that happen to email first.
The upside is measurable, not theoretical. When health signals feed automated playbooks and explanation layers directly into CRM workflows, one documented account prioritization engine using explainable AI lifted renewal bookings by over 8% in a controlled test, with CSM adoption of the tool reaching roughly 85%. That adoption number matters as much as the lift. A score nobody trusts or checks produces zero retention impact, no matter how well it is built.
Which Signals Should Feed an Account Health Score?
Five signal categories capture most of the predictive power available to a CSM team, and piling on more rarely improves accuracy enough to justify the added complexity.
- Usage trend: login frequency and depth of engagement over a rolling window, not a single snapshot. Declining logins is one of the most reliable early warnings; one analysis found login frequency decline preceded 68% of churn events it studied.
- Feature adoption breadth: how many licensed seats are active and how many core features an account actually uses, versus features they pay for but ignore.
- Support tickets and sentiment: open severity-1 tickets, time-to-resolution trends, and repeat complaints about the same issue.
- Billing and payment health: failed payments, past-due invoices, and downgrade requests, which are often lagging but unambiguous signals.
- Relationship and survey sentiment: NPS or CSAT scores, particularly a detractor response from an economic buyer or champion.
Pro Tip: Resist the urge to add a sixth or seventh category just because the data exists. Teams that stop at five to eight weighted signals see faster CSM adoption than teams running fifteen-variable models nobody can explain in a QBR.
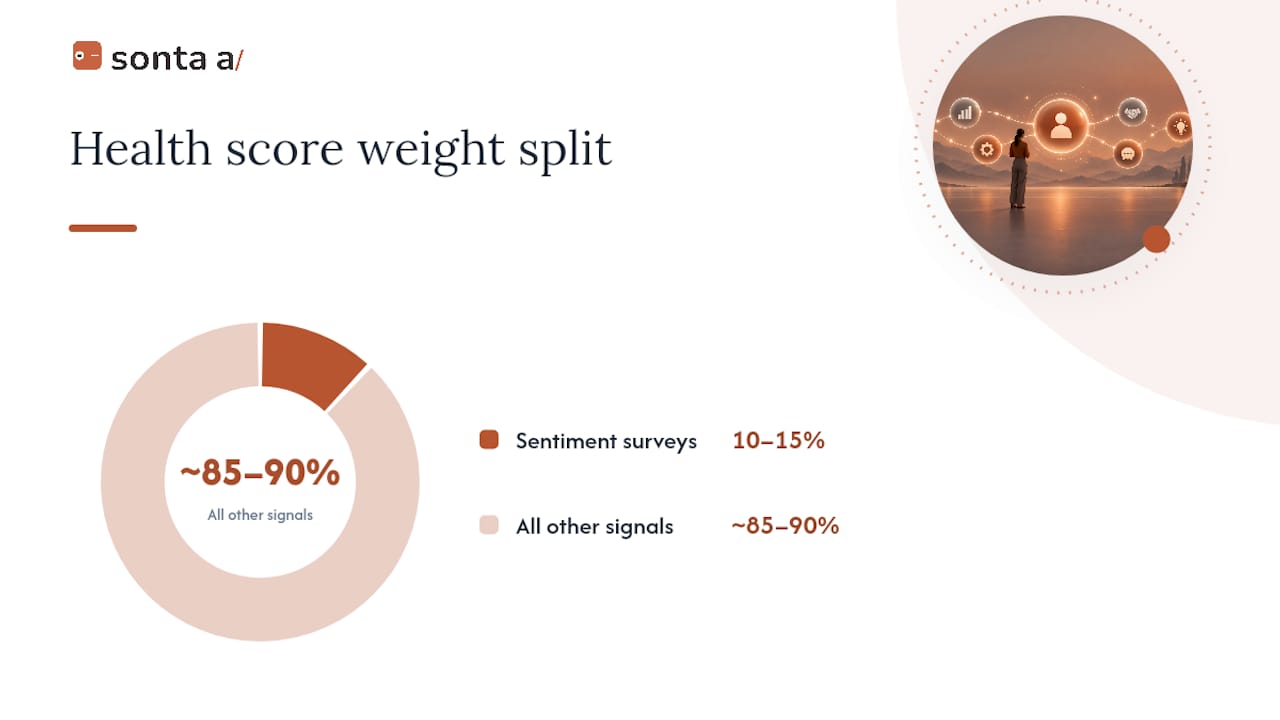
Each signal also carries a different rhythm. Usage and support data update daily or weekly and behave as leading indicators. Billing events are lagging but nearly always urgent. Sentiment surveys update quarterly at best, which is exactly why they should never carry more than 10 to 15% of total weight; a metric that refreshes four times a year cannot drive a weekly score on its own.
How Do You Calculate an Account Health Score?
Building the score is a four-step process, and none of the steps require machine learning to start.
- Normalize every raw signal to a 0-100 scale. Use percentile ranking against your account base for continuous metrics like login count, capped ratios for signals with a natural ceiling (seats activated out of seats purchased), and a baseline-versus-current-trend comparison for anything where direction matters more than absolute level.
- Compute a subscore for each category. Average or weight the normalized signals within usage, adoption, support, billing, and sentiment so each category produces one 0-100 number.
- Apply category weights that sum to 100 and add them into a single composite. This is the number that lands on the account record.
- Layer hard overrides on top of the math. A failed payment or an open severity-1 ticket should be able to force an account into a red tier regardless of what the weighted average says, because averaging alone lets a strong usage subscore mask a genuinely urgent problem.
A basic spreadsheet or SQL version of the composite step looks like this:
In SQL, that’s a single SUM(subscore * weight) expression joined off account ID, which most teams can build once their login, support, and billing tables share a common key.
What Weights and Thresholds Should You Use?
A defensible starting point, drawn from patterns across multiple health-scoring frameworks, weights usage at 30%, adoption at 25%, support at 20%, billing at 15%, and NPS at 10%. Usage and adoption carry the most weight because they are leading indicators with the longest lead time; billing and NPS carry less because one is lagging and the other refreshes too rarely to drive a weekly number.
Tiers translate the composite into action:
- Green (80 to 100): monitor passively, no CSM action required this cycle.
- Yellow (60 to 79): CSM outreach required within five business days.
- Orange (40 to 59): escalate to a senior CSM or CS manager, schedule a call within 48 hours.
- Red (below 40): immediate escalation, often involving sales or an executive sponsor.
Pro Tip: Pair every score with a confidence indicator based on data freshness. An account with stale usage data from a broken integration should never display a clean green score. Flag it as low confidence instead of letting missing data masquerade as good health.
Hard overrides exist precisely to prevent the “averaging trap,” where a healthy usage subscore drags an account into green even though a payment just failed.
How Do You Validate and Recalibrate a Health Score?
A score that has never been checked against actual outcomes is a guess dressed up as data. Validation closes that gap.
- Pull 12 to 24 months of historical account data, labeled with actual outcomes: renewed, expanded, downgraded, or churned.
- Run a regression or correlation analysis between each signal category and the churn outcome to see which weights actually predict what happened, not just what the model assumed.
- Track four ongoing metrics: lead time between a tier drop and the eventual outcome, overall accuracy, false-positive rate (accounts flagged red that renewed anyway), and CSM adoption rate of the score itself.
- Recalibrate on a quarterly cycle, jointly owned by RevOps and a CS analyst, comparing predicted tiers against the trailing 90 days of renewals.
Teams that stick to this quarterly recalibration cadence see predictive accuracy improve by 8 to 12 percentage points over a year, largely because weights that made sense at launch drift as the product, pricing, or customer base changes.
How Do You Operationalize Health Scores in CRM Workflows?
A health score that lives in a static dashboard changes nothing. It has to surface where CSMs already work and trigger action without requiring anyone to remember to check it.
- Embed the composite score and its top two or three drivers directly on the account record, not in a separate reporting tool.
- Auto-generate a CSM task the moment an account crosses a tier boundary, tagged with the specific driver that caused the move.
- Build automated triggers for common patterns: a failed payment fires a billing recovery playbook, a usage drop below a percentile threshold fires an adoption check-in, a detractor NPS response routes to a manager.
- Track time-to-intervention as its own KPI, measuring how long it takes a CSM to act after a tier drops, not just whether the score exists.
The explainability piece is not optional. The account prioritization engine A/B test cited earlier that lifted renewal bookings also found that surfacing the “why” behind each score drove the 85% adoption rate. CSMs who understand a score’s drivers act on it; CSMs handed a bare number tend to ignore it within a few weeks. Platforms built around agentic CRM automation can push this further by having agents draft the outreach or update the record automatically once a trigger fires, rather than just flagging that a human should eventually do something.
Worked Example and Sample Playbook Templates
Take the composite calculated earlier: a score of 68, landing squarely in the yellow tier. The driver breakdown shows support health at 55 and NPS at 40 pulling the number down, while billing at 90 and adoption at 80 are strong.
A Yellow tier playbook typically includes:
- CSM reviews the two lowest subscores within five business days.
- CSM sends a personalized check-in referencing the specific friction point (open ticket, low feature adoption).
- CSM logs the outcome and any manual override reason in the CRM.
A Red tier playbook escalates further: same-day internal alert to the account owner and CS manager, a call scheduled within 48 hours, and an automatic flag to sales leadership if the account carries meaningful ARR. Most teams can prototype this entire workflow in a spreadsheet or BI tool within a few hours once login, support, and billing data share a common account ID.
Who Builds and Trusts These Scores, and Why It Works
Sonta AI approaches customer relationships as an AI-native CRM built for GTM teams that need real-time signal, not stale exports. Its records update automatically as usage, billing, and support events happen, which is the exact data foundation a health score depends on. The platform’s AI Efficiency Diagnostic surfaces operational leakages, including scoring gaps, in about 30 minutes, and its reporting layer is built to surface score drivers alongside the number itself, not bury them in a separate tool.
What CS Leaders Get Wrong About Health Scoring
Most teams over-invest in model sophistication and under-invest in adoption. A five-signal, four-tier score that every CSM checks daily beats a fifteen-variable model nobody trusts.
Ownership and cadence decide outcomes more than the underlying math does. A score with no quarterly owner drifts out of relevance within two quarters, regardless of how well it was built on day one.
— Pavel
Put Account Health Scoring on Autopilot
Building the spreadsheet version of a health score is a weekend project. Keeping it accurate, wired into every CSM’s task list, and recalculated as data changes in real time is the part that breaks most homegrown systems within a few months. Sonta AI is built to close that gap: because records update themselves as usage, billing, and support events happen, the underlying signals feeding your score never go stale, and the agentic workflows can fire a playbook the moment an account crosses a tier line instead of waiting for a human to notice.

If you want to see where your own account data has gaps before you build on top of it, the AI Efficiency Diagnostic gives you a 30-minute read on operational leakages in your current stack. From there, the pricing page walks through Solo, Core, Pro, and Enterprise plans so you can match implementation scope to your team’s size. If your CRM data needs a cleanup pass first, pairing that diagnostic with a CRM data audit before you build scoring on top of it is worth the extra hour.
Sources
- Customer Health Score: Build One That Predicts SaaS Churn
- Account Prioritization Engine with Explainable AI
- How should a 2027 CS team design a customer health score?
- How to build a customer health score | Basedash
FAQ
What Is a Good Account Health Score?
A score above 80 on a 0-100 scale generally signals a healthy account requiring only passive monitoring. Anything below 60 warrants CSM outreach, and below 40 typically triggers escalation under most tiered frameworks.
How Often Should Account Health Scores Be Updated?
Most mature programs update the composite weekly, since usage and support signals change fast enough to shift risk within days. Billing and sentiment inputs update less often, which is why weekly recalculation of the full composite, not just the fast-moving signals, keeps the score current.
How Many Signals Should an Account Health Score Include?
Five to eight signals across usage, adoption, support, billing, and sentiment capture most of the predictive power available. Adding more signals rarely improves accuracy enough to offset the complexity it adds for CSMs trying to interpret the score.
Can Account Health Scoring Predict Churn Accurately Without Machine Learning?
Yes. A transparent weighted composite with hard overrides for critical events is the recommended starting point, and teams should move to a hybrid rule-based and ML model only once they have enough labeled churn outcomes to train it reliably.
Does Sonta AI Support Account Health Scoring Workflows?
Sonta AI’s agentic CRM keeps account records updated in real time, which is the data foundation any health score needs, and its reporting tools surface score drivers directly where CSMs work. Current plan pricing is listed on the Sonta AI pricing page.