30 Minute AI Diagnostic: Sales Efficiency Audit for RevOps

A sales efficiency audit is a time-boxed, data-driven diagnostic that examines pipeline, process, people, compensation, and tools to find exactly where revenue leaks out of the funnel. Run correctly, using a tiered metrics model similar to what Gartner recommends, it produces a prioritized remediation roadmap within days, not months. Fast versions of efficiency diagnostics surface quantified gaps in about 30 minutes; a fuller manual audit typically takes two to four weeks.
TL;DR:
- A sales efficiency audit should be run after two consecutive quarters of missed quotas, forecast slippage, or longer sales cycles without bigger deals.
- Key pillars to review include lead qualification speed, stage exit criteria, pipeline coverage, management practices, compensation alignment, and enablement content usage.
- Using AI tools can provide a rapid, directional leak diagnosis within 30 minutes, identifying structural issues like broken routing rules or misaligned stage gates.
- Prioritize quick fixes that impact revenue, such as improving response times or gating deals with mandatory next steps, before tackling slower, systemic changes.
- Ongoing monitoring with dashboards and regular re-assessment is essential to sustain improvements and catch regressions early.
Table of Contents
- What a Sales Efficiency Audit Covers and When to Run One
- Core Components to Review Across Six Functional Pillars
- A Step-by-Step Sales Process Audit Checklist You Can Run in 30 Days
- Metrics and KPIs That Actually Predict Revenue
- CRM, Data, and Tech Checks That Determine Whether You Can Trust the Audit
- Turning the Gap Analysis Into a Prioritized Remediation Roadmap
- Turning Audit Findings Into Dashboards, Coaching, and Fast Wins
- How AI Speeds Up a Sales Efficiency Audit
- Examples of Sales Efficiency Audits That Found Real Leakage
- Getting Stakeholders on Board Before and During the Audit
- Benchmarking Audit Findings Against Industry Standards
- Keeping the Gains: Post-Audit Monitoring and Continuous Improvement
- Mistakes Auditors Keep Making
- Run the Diagnostic Instead of Guessing Where Revenue Leaks
- Authoritative Reading and Tools to Validate Findings
- Sources
- FAQ
What a Sales Efficiency Audit Covers and When to Run One
A proper sales process audit is not a rep performance review with a fancier name. It’s a structured look at the machinery around your sellers: pipeline math, stage exit criteria, CRM configuration, data integrity, manager rituals, compensation design, and enablement content. GSR Revenue Group’s framework treats these as six interconnected pillars, because a broken comp plan can produce the same symptoms as a broken CRM field, and you need to know which one is actually costing you deals.
Certain triggers should push a sales efficiency audit onto your calendar immediately rather than waiting for the annual planning cycle:
- Two or more consecutive quarters of missed quota
- Forecast accuracy sliding noticeably below your historical baseline
- Sales cycles stretching longer without a corresponding increase in deal size
- A leadership change, new product launch, or CRM migration that resets how the team works
Common triggers like these are well documented across practitioner audit frameworks. For steady-state teams, a “light” audit every quarter (metrics review, spot-check calls) keeps drift in check. A full six-pillar audit makes sense annually, or immediately after any of the triggers above.
Core Components to Review Across Six Functional Pillars
Each pillar needs its own evidence trail, not a gut check. Here’s what to pull and what typically breaks:
- Lead capture and qualification velocity. Pull time-to-first-touch and lead-to-opportunity conversion from your CRM. The usual failure mode: leads sit untouched for hours because routing rules are outdated or nobody owns after-hours coverage.
- Stage definitions and exit criteria. Review 15 to 20 opportunities across every stage. The common gap is stages with no objective exit test, so deals “advance” on optimism rather than evidence.
- Pipeline coverage and conversion by stage. Compare current coverage ratio against historical win rates. Failure mode: coverage looks healthy in aggregate but is concentrated in two reps, masking a team-wide shortfall.
- Management and coaching systems. Sit in on live deal reviews or listen to five to ten recorded 1:1s. Failure mode: managers review forecasts, not deal quality, so coaching never touches the actual skill gap.
- Compensation alignment. Map comp plan mechanics against the behaviors you actually want. Failure mode: a plan that rewards booked revenue over renewal quality quietly erodes retention.
- Enablement and collateral effectiveness. Check content usage data and ask reps which assets they actually use. Failure mode: a content library nobody opens past onboarding.
A Step-by-Step Sales Process Audit Checklist You Can Run in 30 Days
A 30-day audit sequence works because it separates people problems from process problems from pipeline problems, in that order, so you don’t waste a training budget fixing a CRM issue.
- Week 1: baseline and data hygiene. Pull the last four to six quarters of pipeline, win rate, cycle length, and deal size data. Flag duplicate records, missing close dates, and stale opportunities. Deliverable: a metrics snapshot everyone agrees is accurate.
- Week 2: deal-level and call reviews. Sample around 20 opportunities spanning the full funnel and 10 to 20 recorded calls covering top, middle, and bottom performers, a sampling approach SmartMoves outlines in detail. Deliverable: annotated call clips and a list of recurring objection or messaging gaps.
- Week 3: management cadence observation. Sit in on pipeline reviews, forecast calls, and 1:1 coaching sessions. Deliverable: a map of which managers coach on skill versus which ones just check activity boxes.
- Week 4: talent, comp, and roadmap. Cross-reference performance against comp structure and enablement usage, then compile every finding into a single prioritized gap list.
Pro Tip: If your CRM data is too messy to trust for Week 1, don’t wait for a perfect data set. Run the call and deal reviews in parallel. Qualitative evidence from 20 real opportunities often exposes the same structural issues that clean data would, just faster.
Metrics and KPIs That Actually Predict Revenue
Gartner’s three-tier measurement model is the cleanest way to organize audit metrics, because it separates what leadership cares about from what actually predicts it.
- Tier 1, outcomes: revenue attainment, win rate, net retention.
- Tier 2, lagging indicators: average deal size, sales cycle length, quota attainment distribution across the team.
- Tier 3, leading indicators: lead response time, call-to-meeting conversion, interaction quality, and next-step discipline in the CRM.
The audit’s real diagnostic power comes from testing whether Tier 3 behaviors correlate with Tier 1 outcomes. If reps who respond to leads within an hour close at double the rate of reps who take a day, that’s your highest-leverage fix, and it’s cheaper to correct than a comp overhaul. Gartner notes that AI tools are increasingly used to quantify interaction value at the Tier 3 level, since manually scoring call quality across hundreds of calls doesn’t scale for most teams.
During remediation, build a simple dashboard tracking three widgets: response time trend, stage-to-stage conversion, and forecast accuracy versus actuals. Those three catch most regressions before they hit revenue.
CRM, Data, and Tech Checks That Determine Whether You Can Trust the Audit
An audit built on bad data produces confident, wrong conclusions. Before you trust any finding from the sections above, verify the plumbing underneath it:
- Integration inventory. List every tool feeding the CRM (dialer, email, marketing automation, calendar) and confirm each sync is actually current, not silently broken.
- Data health metrics. Check field completion rates on required opportunity fields, sync latency, and duplicate contact or account rates.
- Activity capture effectiveness. Compare logged calls and emails against what your dialer or email platform actually recorded. Gaps here mean your Tier 3 metrics from the previous section are fiction.
- Instrumentation gaps. Identify which stages, fields, or activities have no automated capture and rely entirely on manual entry, since those are where data quality erodes fastest.
Quick fixes tend to have outsized impact relative to effort: making economic-buyer and next-step fields required before a deal can advance stages, auto-capturing call and email activity instead of relying on manual logs, and prioritizing the one or two integrations that feed your Tier 1 dashboards. Tools built for AI-native record updates reduce this manual-entry burden structurally rather than patching it stage by stage.
Turning the Gap Analysis Into a Prioritized Remediation Roadmap
Every finding from the audit needs a score, not just a description. GSR Revenue Group’s rubric is simple and effective: rate each finding 1 to 5 on revenue impact, rate it 1 to 5 on implementation speed, then multiply the two scores to get a priority number.
- Revenue impact is estimated from the pipeline math: if fixing lead response time lifts conversion by even a few points on your current volume, that’s a calculable dollar figure, not a guess.
- Implementation effort accounts for how many teams, systems, or approvals a fix touches.
| Finding type | Revenue impact | Implementation speed | Priority tier |
|---|---|---|---|
| Required-field gating on CRM stages | High | Fast | Quick win |
| Lead routing and response-time fix | High | Fast | Quick win |
| Comp plan redesign | High | Slow | Structural, sequence for quarter two |
| New stage definitions and exit criteria | Medium | Medium | Structural, sequence for quarter one |
| Full enablement content rebuild | Medium | Slow | Structural, longer horizon |
Sequence quick wins first. They build credibility for the harder structural changes coming later, and they usually move Tier 3 metrics within weeks.
Turning Audit Findings Into Dashboards, Coaching, and Fast Wins
Findings that live in a slide deck die in a slide deck. They need to become the thing managers look at every week.
- Rebuild manager dashboards around the audit baseline, using the same Tier 1 to Tier 3 metrics you measured during the audit, so progress is comparable, not reinvented.
- Run a 30 to 90 day validation sprint where each prioritized fix has an owner and a metric it’s expected to move.
- Convert findings into coaching prompts. If call reviews showed reps skip discovery questions, give managers a specific prompt to check for in every 1:1, not a generic “coach more” directive.
- Remove forecast optimism with gating rules. Require documented next steps and, for larger deals, economic buyer engagement before a deal can move to proposal stage.
Pro Tip: Archive any opportunity with zero activity in 30 to 45 days instead of letting it sit in the pipeline. Stale deals inflate forecasts and quietly distort every conversion rate you calculate afterward.
How AI Speeds Up a Sales Efficiency Audit
Manual audits are thorough but slow, and a lot of the delay is just data assembly, not analysis. Certain AI-powered diagnostic tools compress the baseline-gathering work of Week 1 into roughly 30 minutes by pulling directly from your existing tech stack and flagging leakage points automatically.
- Use such diagnostics when you need a directional read fast, before deciding whether a full four-week audit is worth the resource commitment.
- Use a full manual audit when the diagnostic flags something structural, like comp misalignment, that needs deal-level and call-level evidence to confirm.
- Once findings are in hand, Sonta AI Academy’s reporting resources show how to convert them into manager-facing dashboards without rebuilding your reporting stack from scratch.
- Because AI agents can log and structure activity automatically, the instrumentation gaps described in the tech-check section above shrink considerably once they’re in place.
Examples of Sales Efficiency Audits That Found Real Leakage
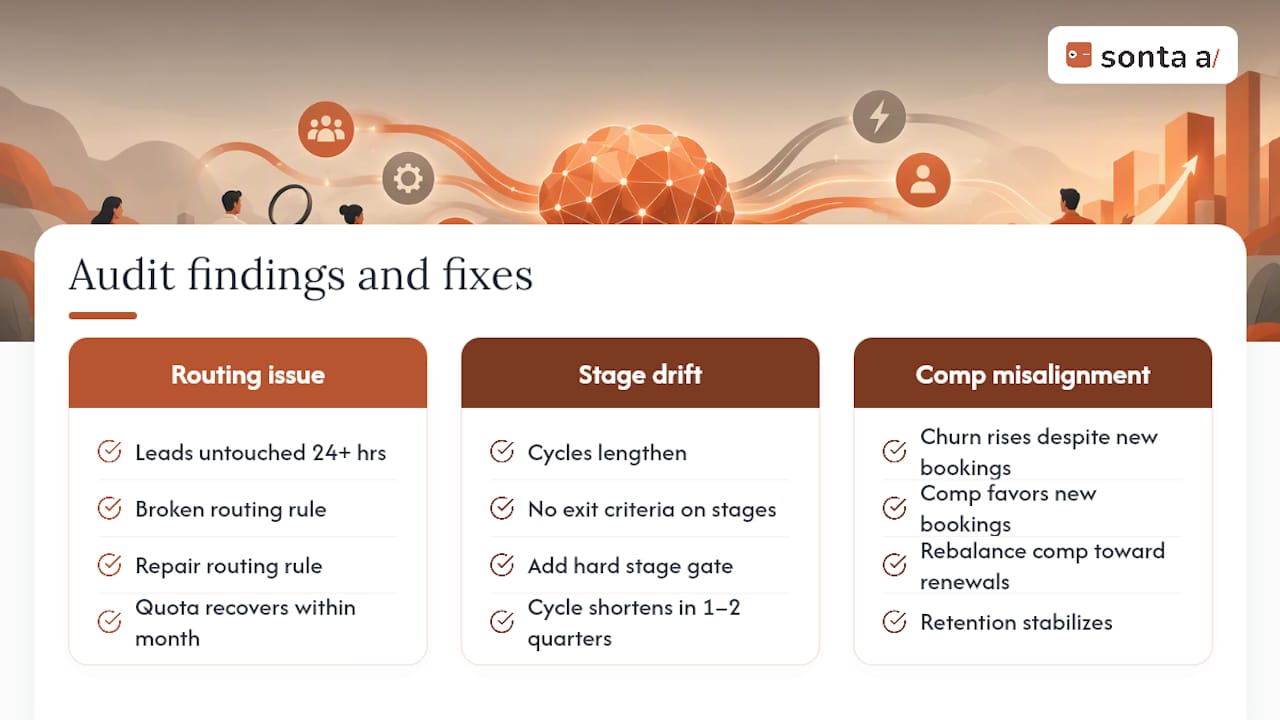
The pattern shows up consistently across practitioner case work: teams assume they have a talent problem when they actually have a process problem. One recurring example from audit playbooks involves a team missing quota for two straight quarters where leadership’s first instinct was to replace underperforming reps. A structured audit instead found that leads were sitting untouched for over 24 hours due to a broken routing rule introduced during a CRM migration. Fixing the routing rule, not the roster, closed most of the gap within a month.
Another recurring pattern involves sales cycles stretching without a corresponding rise in deal size, a classic audit trigger. Deal-level reviews frequently trace this to stage definitions with no exit criteria, so opportunities drift for weeks in a “negotiation” stage where no actual negotiation is happening. Adding a hard gate, requiring a documented next step and a proposal sent within a set window, tends to compress cycle length measurably within one to two quarters.
A third common finding involves compensation quietly undermining retention. Teams that pay heavily on new bookings and lightly on renewals often see churn creep upward even while new revenue looks healthy. Audits that map comp mechanics against actual behavior expose this misalignment clearly, because the data shows reps deprioritizing renewal conversations in the exact months comp plans reward new-logo pushes hardest.
What connects all three: the fix was structural (routing rules, stage gates, comp weighting), not a training program aimed at individual reps.
Getting Stakeholders on Board Before and During the Audit
An audit that surprises people with its conclusions gets resisted, no matter how solid the data is. Bring in the right voices early, and the remediation roadmap gets adopted instead of argued with.
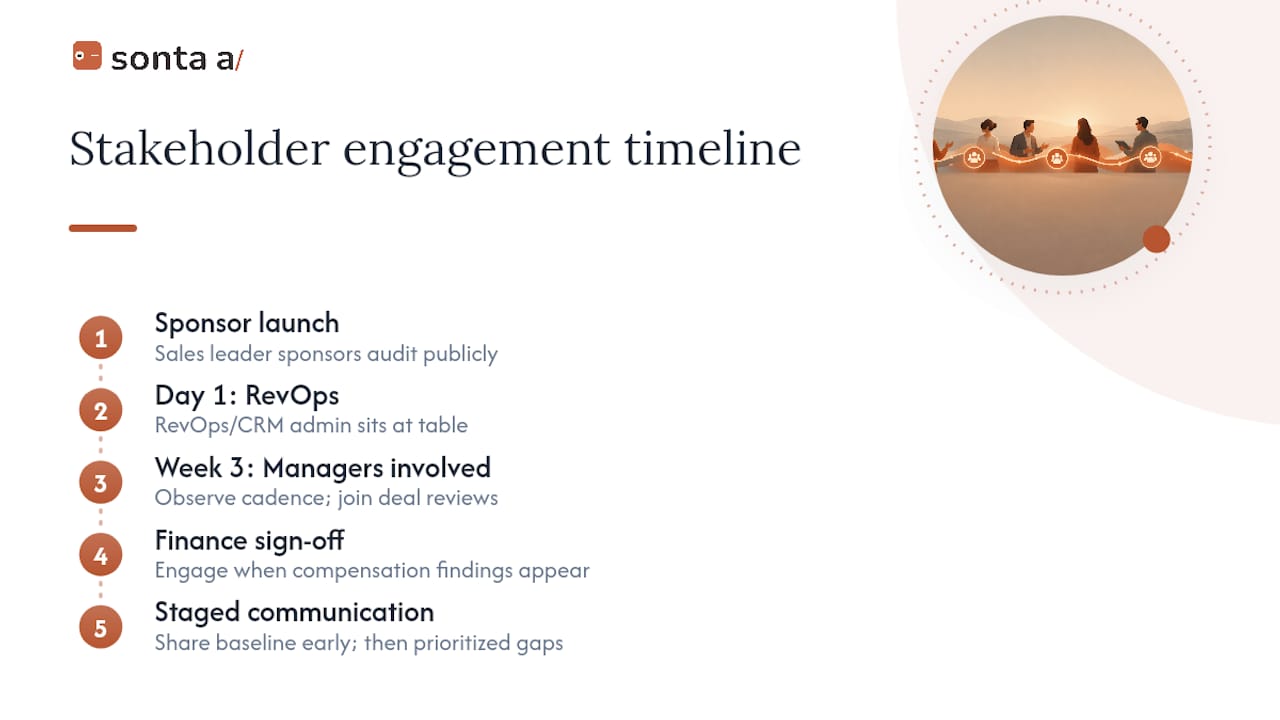
Sales leadership needs to sponsor the audit publicly before it starts, so reps understand it’s a process evaluation, not a stealth performance review. That distinction matters practically: if reps think they’re being individually graded, they’ll shape their answers in interviews and call samples stop reflecting real behavior.
Frontline managers should be looped in during Week 3’s cadence observation, not just handed conclusions in Week 4. Managers who watch their own deal reviews get scored against a coaching rubric are far more likely to change their behavior than managers who read about it in a report.
RevOps or the CRM administrator needs a seat at the table from day one, since most of the data-integrity findings in the tech-check section depend on someone who actually understands why fields are configured the way they are.
Finance or the CFO’s office matters most when compensation findings surface, because comp redesign touches budget and requires sign-off beyond the sales organization.
Communicate findings in stages rather than one big reveal: share the metrics baseline early so nobody disputes the starting numbers later, then present the prioritized gap list once, with the two-axis scoring from the remediation section attached so the sequencing looks earned rather than arbitrary.
Benchmarking Audit Findings Against Industry Standards
Raw audit numbers mean little without a comparison point.
The most reliable external benchmarks come from named research bodies rather than anecdotal blog posts. Gartner’s sales performance research offers tiered outcome and leading-indicator benchmarks that hold up across industries because they’re built around behavior categories (response time, interaction quality) rather than industry-specific averages that shift year to year.
Internal historical benchmarking works just as well when external data is thin. Compare current-quarter Tier 1 and Tier 2 metrics against your own trailing four to six quarters, the same window you pulled during Week 1 baselining. A team whose cycle length has crept up 15% against its own history has a clear, defensible finding, regardless of what any external benchmark says.
Competitor benchmarking is the least reliable option, since most companies don’t publish win rates or cycle lengths, and secondhand claims about a competitor’s sales efficiency are usually marketing, not measurement. Treat any competitor comparison as directional color, never as the basis for a remediation decision.
The most useful benchmark discipline is simply consistency: measure the same metrics the same way every quarter, so this audit becomes the baseline the next one gets compared against.
Keeping the Gains: Post-Audit Monitoring and Continuous Improvement
An audit’s value evaporates within two quarters if nobody keeps watching the metrics it flagged. Treat the remediation roadmap as the start of an ongoing cadence, not a closed project.
Set a recurring review, monthly for the first quarter after the audit, then quarterly afterward, that revisits the same Tier 1 through Tier 3 metrics from the KPI section. This is where the dashboard built during remediation earns its keep: if response time creeps back up three months after the fix, the dashboard shows it before it shows up in a missed quota.
Assign an owner to each fix from the prioritization table, not just to the audit as a whole. A required-field gating rule that nobody owns tends to get quietly disabled the first time it blocks a deal someone wants to push through.
Re-run a light version of the audit, the metrics snapshot and a small call sample, every two quarters even without a trigger event. Catching drift early is cheaper than waiting for another missed-quota streak to force a full audit. Sales assessment frameworks consistently stress that baselines only have value if someone actually re-measures against them, and that discipline is usually the difference between an audit that changes the business and one that just changes a slide deck.
Mistakes Auditors Keep Making
The biggest error is treating a process audit like a performance review, which makes reps guard their answers and hides the real structural problems. A close second is jumping straight to a training fix before the data says training is the actual issue. Watch for red flags like stages with no exit criteria, deals with no activity in weeks, or proposals sent with no documented economic buyer. And change one variable at a time. Fixing comp, CRM, and coaching simultaneously makes it impossible to know which fix actually worked.
— Pavel
Run the Diagnostic Instead of Guessing Where Revenue Leaks
A manual audit is thorough, but a full six-pillar review still takes real calendar time from managers who are already stretched. Sonta AI’s AI Efficiency Diagnostic delivers a quantified gap analysis in about 30 minutes by connecting directly to your existing CRM and tech stack, no weeks of call sampling required to get a directional read on where you’re losing revenue.

The diagnostic works as a practical first pass: it flags the operational leakage points, and if something structural turns up, comp misalignment or a broken stage-gating rule, you can follow up with the deeper deal-level review the checklist above walks through. Because Sonta AI’s agentic CRM updates records in real time instead of relying on manual entry, many of the data-integrity issues that undermine traditional audits get addressed structurally rather than patched after the fact.
Once you have a report, the next step is turning it into the manager dashboards and coaching prompts described earlier, something Sonta AI Academy’s reporting library is built to support directly. Plans start at the Solo tier for smaller teams and scale up to Pro and Enterprise for larger GTM organizations. Run the diagnostic first, then decide whether a guided implementation makes sense for your team.
Authoritative Reading and Tools to Validate Findings
- Gartner: sales performance measurement
- GSR Revenue Group audit framework
- SmartMoves 30-day audit plan
- Sonta AI Academy: Blueprints
Sources
- Transform your approach to measuring sales performance | Gartner
- What Is a Sales Process Audit? | GSR Revenue Group
- Sales effectiveness audit: a 30-day audit plan to find revenue leakage | SmartMoves Inc
- 5C’s predictable revenue healthcheck report — The Selling Collective
FAQ
What Is a Sales Efficiency Audit?
A sales efficiency audit is a structured review of pipeline, process, people, compensation, and tools that identifies where revenue is leaking and produces a prioritized remediation roadmap. It differs from a performance review because it evaluates the system around reps, not just individual output, and typically finishes with baseline metrics for tracking improvement, per sales assessment frameworks.
What Is the 3-3-3 Rule in Sales?
The 3-3-3 rule generally refers to a prospecting cadence: three touches across three channels over three days to reach a lead before it goes cold. It’s a tactical guideline rather than a formal audit metric, and teams should validate it against their own response-time data rather than treating it as universal.
What Is an Efficiency Audit?
An efficiency audit examines whether a business process produces its intended output with minimal waste, using data collected directly from the systems involved (CRM records, call logs, financials). In sales, that means measuring conversion, cycle length, and activity data against the resources spent to generate them, following the structured approach GSR Revenue Group outlines.
What Are the 5 C’s of Auditing?
Definitions of the “5 C’s” vary by discipline and source, and no single version is universally standardized for sales audits specifically. Rather than force-fitting an unclear framework, most sales-specific audits are better organized around the six functional pillars covered earlier: capture, stages, pipeline, management, compensation, and enablement.
What Are the Top 5 Sales KPIs?
The most commonly tracked KPIs are win rate, average deal size, sales cycle length, quota attainment, and lead response time, spanning Gartner’s Tier 1, Tier 2, and Tier 3 framework. Response time and interaction quality (Tier 3) are worth weighting heavily since they tend to predict the Tier 1 revenue outcomes leadership ultimately cares about.