Sales Process Mapping for RevOps: Start with 20 Wins and 20 Losses

A sales process map is a visual blueprint of the observable events a deal moves through, complete with owners, entry and exit criteria, and typical duration at each stage. Built correctly, from recorded deal data rather than memory, it exposes exactly where pipeline stalls and makes revenue forecasting far more predictable. This guide walks through a data-first, step-by-step way to build one, from pulling closed deals to publishing a dated current-state map your team will actually use.
TL;DR:
- Accurate mapping requires analyzing around 20 closed-won and 20 closed-lost deals to identify true stages, owners, and durations from CRM data.
- Each stage in the map must specify entry and exit criteria, including disqualified and no-decision outcomes, to serve as a diagnostic tool.
- The most actionable metrics derived from mapped processes are stage-to-stage conversion rates and median time-in-stage, guiding targeted interventions.
- Regular governance with fixed review periods and stage definition rechecks prevents maps from becoming outdated and losing diagnostic value.
- Integrating mapping with CRM enforcement, automation, and AI tools improves data accuracy, reduces deal stalls, and keeps workflow aligned with the actual sales process.
Table of Contents
- What Is a Sales Process Map, Exactly?
- Why Sales Process Mapping Matters for RevOps Leaders
- Sales Process Map Examples and Templates to Steal
- How to Map Your Sales Process: A Step-by-Step Workflow
- Current State vs. Future State: What the Evidence Says
- Tools That Turn a Map Into an Enforced Workflow
- Metrics That a Mapped Process Actually Lets You Track
- Common Mapping Mistakes and How to Avoid Them
- Making Mapping a Routine Advantage, Not a One-Time Project
- Where Sonta AI Fits Once Your Map Is Built
- Sources
- FAQ
What Is a Sales Process Map, Exactly?
An operational sales process map is built from what happened in the CRM, not what the sales playbook says should happen. That distinction matters more than most teams realize: the aspirational version, drawn in a workshop from memory, almost never matches the paths deals actually took.
A complete map needs six components for every stage: the stage name, a single accountable owner, entry criteria (what has to be true to enter), exit criteria (what has to be true to leave), every possible exit including won, lost, disqualified, and no-decision, and the median duration pulled from timestamped CRM records. Strong maps also mark alternate paths, the branches where a deal skips a stage or loops back.
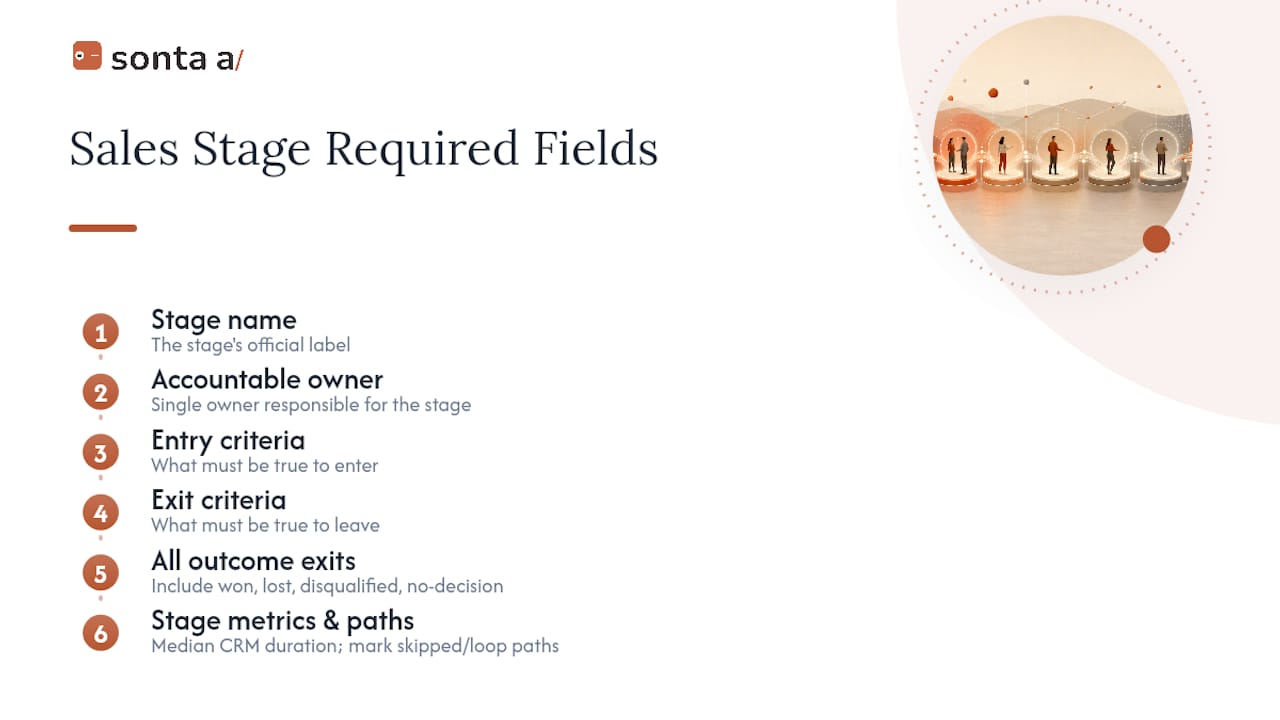
This is a different artifact than a CRM stage picklist. A picklist is a label a rep selects manually. A map documents the entry criteria, owner, every exit including disqualified and no-decision, and typical duration for each stage based on what receiving owners actually needed at each handoff, which is why it functions as a diagnostic tool rather than a dropdown menu.
Why Sales Process Mapping Matters for RevOps Leaders
Ask five reps to describe the sales process from memory and you get five different answers, usually optimistic ones. Mapping from recorded deal events closes that gap between the process people remember running and the one the data shows actually happened, and that gap is usually where the real problems live.
The highest-ROI use cases cluster around four jobs: onboarding new reps against a real map instead of a slide deck, coaching against specific stages where deals stall, tightening forecast accuracy because probability tied to a verified stage means something, and clarifying handoffs between SDRs, AEs, and customer success so nothing drops on the floor.
Mapping delivers the most value at three moments: after a sales motion has run long enough to generate at least a few dozen closed deals, immediately following a reorg or new hire wave when tribal knowledge scatters, and before any multi-step optimization effort that starts, correctly, with auditing the current workflow before touching automation or scoring.
Sales Process Map Examples and Templates to Steal
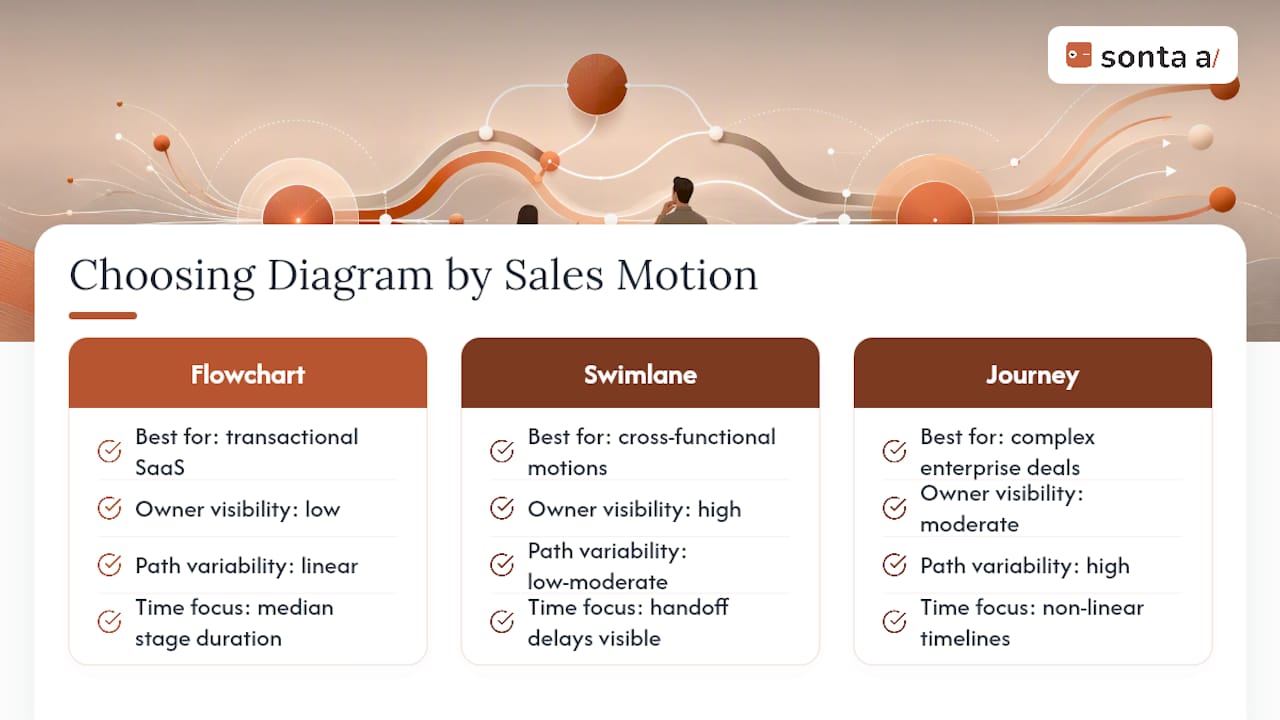
Not every sales motion needs the same diagram. The format should match the problem you are trying to solve. Picking the wrong one is a common reason maps end up ignored.
Simple linear flowcharts work best for high-volume, low-complexity motions, think transactional SaaS or inside sales, where the path from lead to close rarely branches. Each box shows a stage name, entry criteria, and median duration in sequence.
Swimlane diagrams earn their complexity in cross-functional motions. Each horizontal lane represents an owner (SDR, AE, sales engineer, legal), and a deal moving across lanes makes every handoff visible. This format is the fastest way to spot where a deal sits waiting on someone who does not know they own it.
Branching journey maps fit complex buying groups with multiple stakeholders and non-linear evaluation paths, common in enterprise deals with procurement and multiple approvers. Format choice should prioritize what the map needs to communicate: owner clarity, path variability, or time diagnostics, since a single diagram rarely does all three well.
Annotate any template with real median durations and named exit types before treating it as final.
How to Map Your Sales Process: A Step-by-Step Workflow
Building a usable map starts with data, not a whiteboard session. Here is the sequence to follow, following a step-by-step sales process mapping workflow that helps companies expand into a new market.
-
Pull a sample of closed deals. Export roughly 20 closed-won and 20 closed-lost opportunities from the CRM, spread across reps and deal sizes, and extract every dated event: stage changes, meetings, proposal sent, contract signed.
-
Cluster events into named stages. Group the recurring events into stages named for the observable change in the opportunity, “Technical Validation Completed” rather than a vague label like “Mid-Funnel.”
-
Define entry and exit criteria per stage. Write down what must be true to enter a stage and what must be true to leave it, and name every possible exit, including disqualified and no-decision, rather than folding them all into “lost.”
-
Assign an owner to every step. Each stage gets one accountable person or role, and you document exactly what the receiving owner needs at the moment of handoff so nothing stalls in a queue.
-
Calculate median duration from timestamps. Use actual CRM dates, not estimates, to compute median time-in-stage, and flag any deals that skipped a stage entirely, since those alternate paths belong on the map too.
-
Interview around specific deals, not abstractions. Instead of asking a rep to describe “the process,” pull up three named deals and ask who touched it, what it was waiting on, and which steps got skipped. Sampling real wins and losses and interviewing around those specific deals surfaces skipped steps that generic workshop discussions consistently miss.
-
Publish the dated current-state map first. Only after the current-state map is documented and agreed upon should you draft a future-state version, and map old stages to new ones so historical pipeline data stays comparable across the change.
Pro Tip: Date every version of your map in the filename or header. When someone asks “why did our stage-3 conversion rate change last quarter,” the first thing you check is whether the stage definition changed underneath the metric.
Skipping straight to step 6 or 7 without steps 1 through 5 is the single most common shortcut RevOps teams take, and it is why so many maps get built once and never referenced again. The interviews only make sense once you already know, from the data, which deals to ask about.
Current State vs. Future State: What the Evidence Says
Every mapping project produces two artifacts, and confusing them is where most projects go wrong. The current-state map documents what actually happened across sampled deals. The future-state map documents what the team wants to happen next quarter. Only the current-state version is diagnostic.
The gap between the process reps describe from memory and the process the CRM timestamps reveal is usually where the real bottlenecks hide. Drawing what happens, not what should happen, is what turns a whiteboard exercise into an operational tool.
Sampling and interview rules stay consistent regardless of deal volume: pull enough closed deals to cover variation across rep, segment, and deal size, date every event you extract, and draw every observed path, including the messy ones that skip stages or loop back.
Governance matters just as much as the initial build. Change the published map only at defined period boundaries, quarter-end or half-year, not every time someone disagrees with it. When a stage definition changes, re-check any open deals sitting in that stage so forecast numbers do not quietly drift out of sync with what the new definition actually measures.
Tools That Turn a Map Into an Enforced Workflow
A diagram is a picture until it is connected to the CRM. The real value shows up when the map’s exit criteria become something the system checks, not something a rep remembers to do.
Four tool categories cover most of the work:
- Diagramming tools for building flowcharts, swimlanes, and branching journey maps that document the current and future state.
- CRM stage enforcement to turn entry and exit criteria into required fields or validation rules that block a stage change until the criteria are actually met.
- Workflow automation to trigger the right notification, task, or handoff the moment a deal crosses a stage boundary.
- Agreement and e-signature automation for the contract and legal steps, since digitizing agreement workflows is a common source of quick cycle-time wins given how often manual routing and signing creates delay.
Before adding tools, run through a short checklist: does the system support two-way sync so stage changes update in both directions, does it timestamp every stage transition automatically, can it trigger automation at handoffs without a rep remembering to click something, and is there a stable place to store the map artifacts themselves so the current version is never in question. A minimum viable stack usually pairs a CRM with enrichment and sequencing tools before you add intent data or conversation intelligence on top.
Metrics That a Mapped Process Actually Lets You Track
Once stages have real entry and exit criteria tied to CRM timestamps, five metrics become computable and worth watching every week rather than every quarter.
Stage-to-stage conversion rate shows what percentage of deals entering a stage make it to the next one. Median time-in-stage shows how long deals typically sit before moving. Win rate by path separates deals that followed the standard sequence from those that skipped steps. Pipeline velocity combines volume, value, conversion rate, and cycle length into a single trend line. Activity per stage shows how much rep effort each stage actually consumes.
Stage-to-stage conversion rate and average time-in-stage are the two most actionable metrics for deciding where to intervene, since they point directly at drop-off and stall points rather than lagging revenue totals.
The decision rule is straightforward: fix the stage with the lowest conversion rate before the stage with the longest duration, since a leak loses deals permanently while a slow stage only delays them.
Common Mapping Mistakes and How to Avoid Them
Most sales process maps fail for the same handful of reasons, and every one is avoidable.
- Overcomplicating the diagram. A map with 15 stages and every micro-action a rep takes gets ignored; a usable map includes only the touchpoints that change forecast probability.
- Mapping the future state first. Skipping the current-state audit means you are documenting a hope, not a diagnosis.
- Leaving out owners or durations. A stage with no accountable owner and no median duration cannot be used for coaching or forecasting.
- Merging disqualified and no-decision into “lost.” These are different signals requiring different fixes, and collapsing them hides which one you actually have a problem with.
Best practice runs the other direction on each point: keep the map short, annotate wherever reps or managers disagree about a stage definition instead of papering over it, attach every published map to a specific decision (a forecast call, a coaching plan), and set a fixed review cadence tied to period boundaries.
Pro Tip: Before calling a map “done,” hand it to a rep who was not involved in building it. If they cannot recognize their own deals in it within five minutes, the map is either too abstract or too detailed.
Making Mapping a Routine Advantage, Not a One-Time Project
Most sales process maps get built once, presented in a QBR, and then quietly go stale within two quarters. The fix is governance, not effort. RevOps should own the map the way finance owns the chart of accounts: one accountable person, a fixed review cadence tied to period boundaries, and a rule that any stage-definition change triggers a re-check of open deals sitting in that stage.
Once a current-state map exists, use it for more than documentation. Run coaching sessions against the stage where a specific rep’s conversion rate lags the team median. Onboard new hires against the real map, not the aspirational one. Test changes as small experiments, adjusting one entry criterion for a single segment for a quarter, then comparing conversion before and after, rather than rewriting the whole process at once.
— Pavel
Where Sonta AI Fits Once Your Map Is Built
A published map is only as good as the data behind it, and that is where most teams hit a wall. Manual CRM updates mean stage timestamps drift, handoffs get logged late, and by the time someone notices a deal has been stalled for three weeks, it is already cold. Some AI-native CRM platforms use AI agents to keep records self-updating in real time, which helps median durations and conversion rates stay accurate without reps having to remember to log anything.

For teams that suspect their current process has more leakage than their dashboards show, Sonta AI’s AI Efficiency Diagnostic surfaces where deals stall and where handoffs break down in about 30 minutes, without a lengthy audit engagement. Consulting firms and professional services teams running relationship-heavy pipelines can see how this applies on the CRM for consulting firms page, and auto retail groups managing high-volume handoffs between sales and finance can check the automotive CRM for dealers page. If your map is built, the logical next step is booking a walkthrough at Sonta to see how automated enforcement holds it in place.
Sources
For readers who want to go further: RevenueFlow’s guide to mapping from recorded events covers sampling method in more depth, DocuSign’s mapping walkthrough focuses on agreement-stage automation, monday.com’s optimization framework sets mapping inside a full seven-step improvement cycle, and Miro’s flowchart guide breaks down diagram format choices with visual examples.
- Sales process mapping: Draw what happens, not what should | RevenueFlow
- How to create sales process mapping | DocuSign
- Monday
- Mastering the sales process flowchart | Miro
FAQ
How Long Does Building a Sales Process Map Take?
A first current-state map, built from a sample of closed-won and closed-lost deals, typically takes some time of data pulling, clustering, and a handful of deal-specific interviews.
How Many Deals Should I Sample to Map a Process?
A moderate sample of closed-won and closed-lost deals is enough to surface the recurring stages, common exit types, and alternate paths without drowning the analysis in outliers.
Should I Map the Current State or the Future State First?
Always map the current state first, since the diagnostic value comes from documenting what actually happened in recorded deals rather than what the team intends going forward.
What’s the Difference Between a Sales Process Map and a CRM Stage Picklist?
A picklist is a manually selected label; a map documents the entry and exit criteria, owner, every exit type, and median duration behind each stage, which is what makes it useful for coaching and forecasting.
How Often Should a Sales Process Map Be Updated?
Update the published map at fixed period boundaries, such as quarter-end, rather than every time a disagreement comes up, and re-check open deals whenever a stage definition actually changes.