CRM Health Score: Prioritize by Expected Revenue at Risk

A CRM health score is a single, explainable 0-100 metric that predicts churn and highlights expansion opportunities so customer success managers can prioritize action. Bands map directly to playbooks, and explainability plus data freshness are prerequisites for using the score operationally. Platforms like Sonta Ai and metrics frameworks such as the one described by Metabase treat the score as a composite of usage, support, commercial, and relationship signals rather than a single number pulled from nowhere.
TL;DR:
- Limit the model to four to six components, compare usage with purchased seats, and blend short and long lookback windows to balance speed against noise.
- Use 0–40 for immediate outreach, 41–70 for a check in within two weeks, and 71–100 for expansion, tailoring cutoffs to team capacity.
- Rank equally scored accounts by expected revenue at risk, calculated from churn probability and ARR, rather than treating every account as equally urgent.
- Because 24% of CRM admins reported that less than half their data was accurate and complete, assign field owners and freshness limits before scoring.
- Back test scores against outcomes observed after each scoring date, track precision, recall, and retained ARR, and review quarterly using accounts untouched by CSM intervention.
Table of Contents
- What a CRM health score actually measures
- Choosing the right signals and data inputs
- From signals to score: weighting, decay, and drift detection
- Turning score bands into retention and expansion playbooks
- Data governance and operational prerequisites
- Validating and back-testing a health score
- How an AI-native CRM accelerates health score rollout
- Examples of industry-specific customization
- How health scores connect to revenue and customer lifetime value
- Best practices for continuous improvement
- Common challenges and pitfalls to watch for
- Lessons from building and running health scores
- Getting a working health score running faster
- FAQ
- Sources
What a CRM health score actually measures
A CRM health score compresses several signal categories into one number: usage (logins, feature adoption, active seats), support (ticket volume, escalations, resolution time), commercial (payment status, contract value, renewal date), relationship (executive sponsor presence, stakeholder turnover), and sentiment (NPS, CSAT, survey responses). Each category answers a different question. Usage tells you whether the product is embedded in daily work. Support tells you whether friction is building. Commercial tells you whether the account is financially stable. Relationship and sentiment tell you whether the people involved still trust the partnership.
Most teams score on a 0-100 scale, with bands acting as decision thresholds rather than rigid rules. Typically, lower scores indicate accounts at risk needing direct intervention, mid-range scores indicate accounts to monitor, and higher scores signal healthy accounts ready for expansion conversations. These thresholds are guidelines, and the right cutoffs depend on your churn base rate and how aggressively your customer success team can respond. A team with a lean CSM headcount might set the at-risk threshold higher, because they can only chase so many accounts at once.
One distinction gets missed constantly: CRM or system health is not the same as customer or account health. System health measures whether your CRM data itself is clean, current, and complete, things like field population rates, duplicate records, or integration sync status. Account health measures whether the customer relationship is thriving. A customer can have a healthy account and a messy CRM record, and vice versa. Conflating the two produces a score that looks precise but measures the wrong thing. Practitioner guidance from Metabase’s health score framework recommends maintaining these as separate models, because mixing them reduces actionability for the teams relying on the output.
Choosing the right signals and data inputs
Picking signals is where most health score projects succeed or fail. The temptation is to throw every available field into the model, but more inputs do not mean more accuracy, they mean less explainability. A CSM looking at a dropped score needs to know which input moved and why.
Start with signal types that map cleanly to business questions:
- Adoption metrics: percentage of purchased seats actively used, feature-level engagement, or active days in a 28-day window.
- Key-event counts: logins, API calls, or workflow completions tracked over a 7, 28, or 90-day lookback.
- Support signals: escalation count, average resolution time, and repeat-ticket rate on the same issue.
- Sentiment: NPS or CSAT scores, weighted more heavily when recent.
- Commercial status: payment history, days past due, and contract renewal proximity.
- Relationship depth: presence of an identified executive sponsor and stakeholder turnover since onboarding.
Entitlement-normalized measures matter here. Raw login counts mean little without context, but seats used divided by seats purchased tells you whether an account is actually adopting what it paid for. A 50-person license with 10 active users looks very different from a 10-person license with 10 active users, even though the raw usage number might be identical.
Lookback windows shape how reactive the score feels. A 7-day window catches sudden drop-offs fast but reacts to noise, like a key user being on vacation. A 90-day window smooths noise but reacts slowly to a real problem. Many teams blend both: a short window for an early-warning signal and a longer window for the stable baseline score.
Limit the model to four to six components. Fewer than that and you are tracking a single behavior, which leaves the score vulnerable to one noisy input. More than six, and CSMs lose the ability to explain a score change in one sentence, which Metabase’s guidance identifies as the threshold where explainability starts to break down.
From signals to score: weighting, decay, and drift detection
Once you have four to six normalized components, combining them into a single number is a weighted sum. Value-based weighting means giving more weight to the signals that correlate most strongly with your actual outcome, renewal or churn, not the signals that are easiest to collect. A simple pattern looks like this in pseudocode:
health_score = (0.35 * usage_normalized)
             + (0.25 * commercial_normalized)
             + (0.20 * support_normalized)
             + (0.20 * sentiment_normalized)
Each component is normalized to a 0-100 range before weighting, so a support score built from ticket counts and a commercial score built from days-past-due are comparable on the same scale. Store the result with a scored_at timestamp on every run rather than overwriting the previous score. That single design choice is what makes trend lines, not just snapshots, possible, and it is the pattern Metabase recommends for keeping component values visible over time.
Time weighting, or decay, matters because a support escalation from four months ago should carry less weight than one from last week. Applying an exponential or linear decay to time-sensitive components keeps the score responsive without requiring a full model rebuild every time a signal ages.
Drift happens when the relationship between your inputs and actual outcomes shifts, often because the product changed, the customer base changed, or a new segment was onboarded with different usage patterns than your original training data assumed. Research on production CLV and churn systems shows that multi-stage and ensemble modeling frameworks with configuration layers reduce prediction error and support the kind of daily updates needed to catch drift early. When weights stop correlating with renewal outcomes in your periodic back-tests, that is the signal to recalibrate rather than wait for a bigger failure.
Turning score bands into retention and expansion playbooks
A health score only earns its keep when it triggers action. Mapping bands to specific playbooks turns a passive number into an operational routine.
- At-risk (0-40): trigger an immediate CSM outreach task, escalate to a manager if the account’s ARR exceeds a set threshold, and track time-to-first-contact as the KPI.
- Monitor (41-70): schedule a check-in within two weeks, review usage trends against the account’s original success plan, and track whether the score moves up or down at the next scoring run.
- Healthy (71-100): flag for an expansion conversation, loop in sales for upsell qualification, and track conversion rate from flagged to closed expansion revenue.
Raw score alone is not enough to prioritize a CSM’s day. A 35-score account worth $5,000 in annual recurring revenue competes for the same attention as a 35-score account worth $200,000, and that is a mistake. Prioritizing by expected business impact, risk multiplied by ARR, surfaces the accounts where intervention actually matters financially rather than just numerically.
Pro Tip: Route at-risk alerts through the same tool your CSMs already live in, whether that is a Slack channel or a CRM task queue, so the score drives a visible next step instead of sitting in a dashboard nobody checks.
Implementation usually combines a few mechanisms: Slack or Teams alerts for sudden score drops, automatically generated CRM tasks tied to the triggering playbook, and templated outreach sequences so CSMs are not writing the same renewal-risk email from scratch every time. The goal is that a score change produces a task within minutes, not a report somebody reviews at the end of the month.
Data governance and operational prerequisites
A health score is only as trustworthy as the data feeding it. Governance has to come before modeling, not after. The State of CRM Data Management survey found that 24% of CRM admins reported less than half their CRM data was accurate and complete in 2024, and linked poor data quality to measurable revenue loss. A score built on top of that kind of decay inherits the same unreliability, no matter how well the weighting logic is designed.
Three governance practices matter most. First, assign explicit ownership for every field that feeds the score: someone needs to be accountable when the “last login” field stops syncing or the NPS integration breaks. Second, set freshness SLAs, a maximum acceptable staleness for each input, and monitor completeness continuously rather than discovering a broken pipeline three months later when churn predictions stop making sense. Third, expose missingness explicitly. When a sentiment score is missing because a customer never responded to an NPS survey, that absence should be visible, not silently replaced with an average that pretends the data exists.
Basic hygiene work underpins all of this: deduplicating account records, mapping fields consistently across source systems, and aligning entitlement data (seats purchased, contract terms) so usage ratios are calculated against the right denominator. A data quality management framework for CRM platforms makes the point directly: quality rules need to be defined per decision, because a field that is good enough for a sales dashboard might be far too sparse for a renewal prediction. Teams evaluating broader security and readiness questions around CRM data often look at frameworks like SOC 2 compliance guidance as part of preparing their data infrastructure for enterprise customers.
Validating and back-testing a health score
A health score that has never been back-tested is a hypothesis, not a working metric. Validation means checking whether past scores actually predicted what happened next, using data the model would have had access to at the time, not information that only became available later.
The design matters as much as the metric. Time-separated validation means scoring accounts as of a past date, then checking actual outcomes (renewal, expansion, churn) months later, comparing the model’s predictions against a simple baseline like “flag anyone with a support ticket in the last 30 days.” Research on production CLV and churn prediction systems recommends time-based nested cross-validation and explicit checks for feature leakage, since a model that accidentally uses information from after the prediction date will look far more accurate in testing than it performs in production.
An applied deployment documented in the INFORMS Journal on Applied Analytics found that targeting the top 50 at-risk accounts identified more than twice as many true churners compared with random selection, a result achieved through disciplined back-testing and integration into day-to-day workflows rather than through a more complex model alone.
Track precision (of flagged at-risk accounts, how many actually churned), recall (of accounts that churned, how many were flagged in advance), calibration (does a 30-score account actually churn more often than a 60-score account), and the business metric that matters most: retained ARR or expected revenue at risk. A quarterly review cadence, backed by a holdout set of accounts excluded from any manual intervention, gives a clean read on whether the score is adding value beyond what CSMs would have caught anyway.

How an AI-native CRM accelerates health score rollout
Building a health score from scratch usually means weeks of data wrangling before the first version is even testable. We built the AI Efficiency Diagnostic to shortcut that step: a 30-minute audit that surfaces where operational data is leaking and where your tech stack already holds the inputs a health score needs.
From there, the pilot path is short. We run the diagnostic, pull a one-week data sample across usage, support, and commercial fields, and generate a first-pass score with the bands and playbook mapping already attached. Because records in Sonta Ai update themselves in real time rather than depending on manual entry, the inputs that feed account health scoring stay current without someone chasing CSMs to log activity. That matters directly for churn prediction, since a stale usage field produces a stale risk signal no matter how good the weighting formula is.
Governance comes first in our approach, not as an afterthought: field ownership and freshness rules are set before the first score runs, which keeps the diagnostic from producing a number nobody trusts. From there, iteration is a matter of adjusting weights against actual renewal outcomes.
Examples of industry-specific customization
A health score built for a subscription software company rarely transfers cleanly to another industry without adjustment. In real estate CRM use, relationship signals like agent responsiveness and listing activity often carry more predictive weight than product login counts, since the “product” is partly a service relationship. In recruitment, time-to-fill and candidate pipeline velocity often substitute for traditional usage metrics, because the health of the account depends on hiring outcomes, not software engagement alone.
Auto retail accounts often weight commercial signals heavily, tracking inventory turn and financing approval rates alongside CRM usage, since dealership health is tied closely to sales velocity. Professional services firms frequently lean on relationship depth and executive sponsor continuity, since project-based engagements can look quiet in usage data between active phases without that meaning the relationship is at risk.
The common thread across all of these is that the four-to-six component structure stays the same, but which categories carry the heaviest weight shifts based on what actually predicts renewal in that industry. A generic, one-size-fits-all weighting formula applied across industries tends to under-predict risk in some segments and over-predict it in others.
How health scores connect to revenue and customer lifetime value
The reason health scores matter commercially is that they are a leading indicator for lagging financial outcomes. An account’s trajectory through score bands, moving from healthy to monitor to at-risk, tends to precede the renewal decision by weeks or months, which is what makes early intervention possible at all.
Research on production lifetime value prediction systems emphasizes optimizing models for the business decision they support rather than for raw classification accuracy. In practice, that means a health score tied to retention should be evaluated on how well it predicts retained ARR, not just on how many churns it correctly labels. An account scoring in the healthy band is also where expansion conversations convert most reliably, since usage and sentiment data already show the product delivering value worth paying more for.
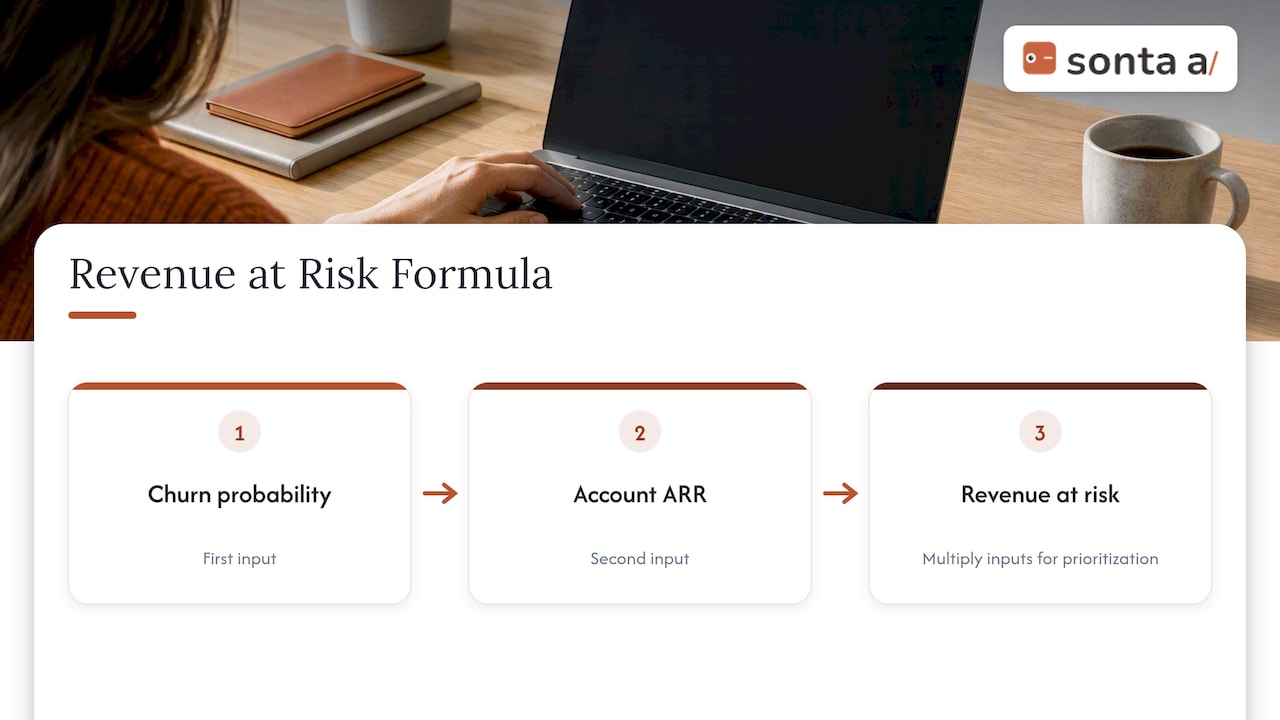
Expected revenue at risk, calculated as churn probability multiplied by account ARR, gives a cleaner prioritization signal than the health score alone, because it accounts for the fact that a large at-risk account and a small at-risk account carry very different financial consequences even at the same score.
Best practices for continuous improvement
A health score is not a one-time build. Weights that correlate well with churn today will drift as your product, customer base, or market shifts. Scheduling a quarterly or semiannual review against actual renewal and expansion outcomes catches that drift before it erodes trust in the score.
Keep a changelog of weighting adjustments and component changes, so when a score’s behavior shifts, the team can trace whether it was a deliberate recalibration or an unplanned data problem. Solicit feedback directly from the CSMs using the score day to day. If they consistently override or ignore the score for a certain account type, that is a signal the model is missing a component relevant to that segment, not a signal to ignore the complaint.
Run periodic back-tests on a holdout set rather than only evaluating the score on the full active book, since the full book includes accounts where CSMs already intervened based on the score, which can make the model look more predictive than it actually is. Finally, resist the urge to add components indiscriminately after every review. Each new signal should earn its place by improving back-tested predictive value, not just by being available in the data warehouse.
Common challenges and pitfalls to watch for
The most common failure mode is building a score nobody trusts because nobody can explain it. A black-box model that outputs a number with no visible component breakdown gets ignored by CSMs within a few weeks, regardless of how statistically sound it is.
Data staleness is a close second. A score built on fields that update inconsistently produces false confidence, flagging an account as healthy simply because nobody has recently logged an interaction, not because the relationship is actually stable. Teams focused on sales data enrichment and field mapping often find this is the first problem worth solving before any scoring logic gets built.
Over-engineering is another trap: adding components because they are available rather than because they are predictive, which produces a model that is harder to explain without being meaningfully more accurate. Conversely, under-investing in governance, skipping field ownership and freshness SLAs, produces scores that look fine until a sync failure goes unnoticed for weeks.
Finally, teams often skip back-testing entirely and deploy a score based on intuition about which signals should matter. Without validation against actual outcomes, there is no way to know whether the score is adding predictive value or just reflecting assumptions that felt reasonable at design time.
Lessons from building and running health scores
The recurring failure pattern we see is explainability treated as a nice-to-have rather than a requirement. A score with strong statistical properties that CSMs cannot interpret gets quietly ignored within a quarter. A second common pitfall is skipping the governance step, assuming data quality will sort itself out once the model is live, when in practice stale fields erode trust faster than a wrong prediction ever does. A third is chasing precision on the overall model while ignoring calibration within bands, so a “70” and a “95” both read as healthy even though they carry very different renewal odds.
A workable checklist: assign a named owner for every input field, set a fixed scoring cadence, hold the component count to four to six signals, keep every component visible to the CSM viewing the score, and back-test quarterly against actual renewal data before trusting the output.
— Pavel
Getting a working health score running faster
Most of the delay in building a health score comes from data wrangling, not modeling. We shortcut that with the AI Efficiency Diagnostic, a 30-minute audit that identifies where your usage, support, and commercial data already exists across your stack and where it is leaking.

From there, a pilot runs in days rather than months: diagnostic, a short data pull, a first-pass score with bands and playbooks attached, then iteration based on what your CSMs actually see. Because Sonta Ai records update themselves in real time, the inputs feeding the score stay current without manual data entry pulling CSM attention away from accounts. If you manage a book of accounts and want a concrete read on what a pilot score would look like with your own data, start with the diagnostic or review plan options to see what a full rollout involves.
FAQ
How do I calculate the customer health score?
Normalize each signal (usage, support, commercial, sentiment) to a common 0-100 scale, then combine them using a weighted sum where weights reflect how strongly each signal correlates with actual renewal or churn outcomes. Store each calculated score with a scored_at timestamp so you can track movement over time, as recommended in Metabase’s health score framework.
How do you measure CRM success?
CRM success is measured through a combination of data quality metrics (completeness, freshness, duplicate rates) and outcome metrics like adoption, retention, and the accuracy of any predictive scores built on top of the data. A CRM with poor data quality undermines both operational use and any scoring model, which is why governance surveys treat data accuracy as a prerequisite rather than a side metric.
What counts as a good health score?
A score above roughly 70 on a 0-100 scale is commonly treated as healthy, 41-70 as needing monitoring, and below 40 as at-risk, though these thresholds should be calibrated to your own churn base rate rather than applied universally. The right cutoff is the one that, when back-tested against your actual renewal data, produces reliable precision and recall for your team’s capacity to intervene.
How do I create a health score in HubSpot?
Most CRMs, including HubSpot, support custom scoring properties built from a weighted combination of existing fields like login activity, ticket counts, and deal stage, which can be configured through workflows or custom-coded actions. The same principles apply regardless of platform: normalize inputs, limit components to four to six signals, and store historical score values so you can validate the model’s predictive accuracy over time.
What data should feed a CRM health score?
Core inputs include product usage and adoption metrics, support ticket volume and escalation rate, payment and commercial status, and sentiment data like NPS or CSAT scores. Each input should be normalized against a relevant denominator, such as seats used against seats purchased, so the score reflects actual engagement rather than raw counts.
Sources
- Customer Health Score: Definition, Weighting & SQL for Metabase
- Geiger Uses Machine Learning to Reduce Customer Churn in the Promotional Products Industry | INFORMS Journal on Applied Analytics
- The State of CRM Data Management in 2024
- A high-performance turnkey system for customer lifetime value prediction in retail brands | Springer Nature