Sales Forecast Accuracy: How to Measure and Improve It

Sales forecast accuracy is how close your predicted revenue lands to what actually closes. You improve it by measuring it the same way every period, keeping deal records current, and reviewing committed deals against evidence each week. The first step is a number you can track. The second is data you can trust. This guide covers both, with a worked example and a weekly routine for a team on HubSpot or Pipedrive.
We built Sonta AI, an agentic CRM that finds opportunities and moves them forward. Forecasts depend on records that stay current. That is where most teams lose accuracy, so we start there.
TL;DR
- Accuracy equals 100% minus the absolute percentage error, measured on closed revenue, in the same period, every time.
- Track bias next to accuracy. Accuracy alone hides a team that always over-commits or always sandbags.
- Most misses start in the data: stale records, vague stage definitions and close dates set by the seller, not the buyer.
- A weekly 30 to 45 minute review of committed deals, recorded in one place, gives you a history to learn from.
- Keep records current automatically where you can. Sonta AI does this as part of the CRM.
Table of Contents
- What sales forecast accuracy measures
- What a good level looks like
- Why forecasts miss
- A weekly routine that improves accuracy
- Fix the data first
- Compare options fairly
- What Sonta replaces and what it costs
- Try it on your own pipeline
- FAQ
- Sources
What sales forecast accuracy measures
Forecast accuracy compares what you said would close with what did close. It says nothing about whether you hit target. A team that forecasts £400,000 and closes £400,000 is perfectly accurate even if the target was £600,000.
This matters for owner-led firms and sales leaders alike. Accuracy is about whether your numbers can be trusted for decisions. Hiring, capacity and cash planning all rest on the forecast, according to KPI Tree. If the forecast is unreliable, those decisions are guesses.
The formula
The standard calculation uses absolute percentage error (APE). We-Enable sets it out as the absolute gap between actual and forecast, divided by actual, times 100. Accuracy is then 100% minus that figure.
Here is an illustrative example. It is a worked calculation, not a real result.
| Quarter | Forecast | Closed | Gap | APE | Accuracy |
|---|---|---|---|---|---|
| Q1 | £400,000 | £350,000 | £50,000 | 14.3% | 85.7% |
| Q2 | £300,000 | £330,000 | £30,000 | 9.1% | 90.9% |
| Q3 | £450,000 | £360,000 | £90,000 | 25.0% | 75.0% |
| Q4 | £380,000 | £400,000 | £20,000 | 5.0% | 95.0% |
The average of the four APEs is 13.4%. This is the mean absolute percentage error, or MAPE. Over the year, accuracy by this measure is 86.6%.
MAPE is useful because one good quarter cannot hide a bad one. Over- and under-forecasts do not cancel out, because you take the absolute gap.
Choose one denominator and keep it
Some teams divide the gap by actual revenue. Others divide by the forecast. The choice changes the score. Ivri Tech’s August 2026 example shows a team scoring 82.5% on one basis and 85.1% on the other, a 2.6-point gap from the denominator alone.
The lesson is simple. Pick one method, write it down and never change it mid-year. A trend only means something if the ruler stays the same.
Forecast error and bias
Forecast error is actual minus forecast. A negative number means you over-forecast. It keeps the sign, so it shows direction.
Bias is the same idea tracked over time. KPI Tree describes bias as the forecast minus actual, divided by actual. A positive figure means the team tends to over-commit. A negative one means it tends to sandbag, which is holding deals back so the number looks safe.
In the table above, three of four quarters have a forecast gap in one direction or the other. Q1 and Q3 were over-forecasts. Q2 and Q4 were under-forecasts. That mix points to noise. A team that over-forecasts four quarters in a row has a process problem, not bad luck.
What a good level looks like
Published benchmarks vary a lot. They depend on industry, deal size, sales cycle and how the forecast is built. A founder-led agency closing a handful of large engagements a quarter will see wider swings than a team closing hundreds of small deals.
The more useful benchmark is your own history. Calculate accuracy for the last four to eight periods. That is your baseline. Aim to improve on it, and aim to narrow bias first.
Horizon matters too. A forecast for the next 30 days should be tighter than one for the next 90. Report them separately. Mixing a one-month and a quarter view into one score makes the number harder to act on.
One more caution. If you recompute a forecast from a live CRM as the quarter closes, the score improves just because time passes. Ivri Tech warns that this measures time, not judgement. Lock the forecast at a fixed date, such as the first day of the period, and score that version.
Why forecasts miss
In our experience of how sales teams run, misses come from a short list of causes. The research agrees.
Poor CRM data
Abertay University’s online business journal (October 2023) names poor CRM data as one of the biggest barriers to accurate projections. It lists inconsistent record-keeping, data decay, duplication and invalid contact details. It adds outdated spreadsheets, manual data entry and human error to the list.
This is the part a forecast formula cannot fix. If a deal sits in “proposal sent” for two months with no activity, the CRM still counts it. Your weighted pipeline then includes revenue nobody is working on.
A consistent way to capture qualification answers at the point of entry helps here. Pre-sales question sets, such as these pre-sales questions for lead capture, show how structured questions produce records that are comparable from deal to deal. Comparable records are what a forecast needs.
Human bias
The same Abertay article points to cognitive bias, lack of accountability, sandbagging, delayed reporting and overconfidence. These are people problems. A rep who loves a deal rates it higher. A rep who wants a quiet quarter hides it.
Weak stage definitions
We-Enable lists the process causes. Pipeline stages have no exit criteria. Close dates are set by the seller, not evidenced by the buyer. Deals have a single contact. Stage probabilities are never checked against real conversion rates. The forecast is treated as a target, which pushes people to bend it.
Each of these is fixable without new software. Together they explain most of the gap between a forecast and reality.
A weekly routine that improves accuracy
We-Enable recommends a weekly CRM-based pipeline review of 30 to 45 minutes. It inspects committed deals, challenges stale ones and records the forecast in the same place every week. That last part is what lets you measure accuracy later.
Here is the routine, step by step, with where it usually goes wrong.
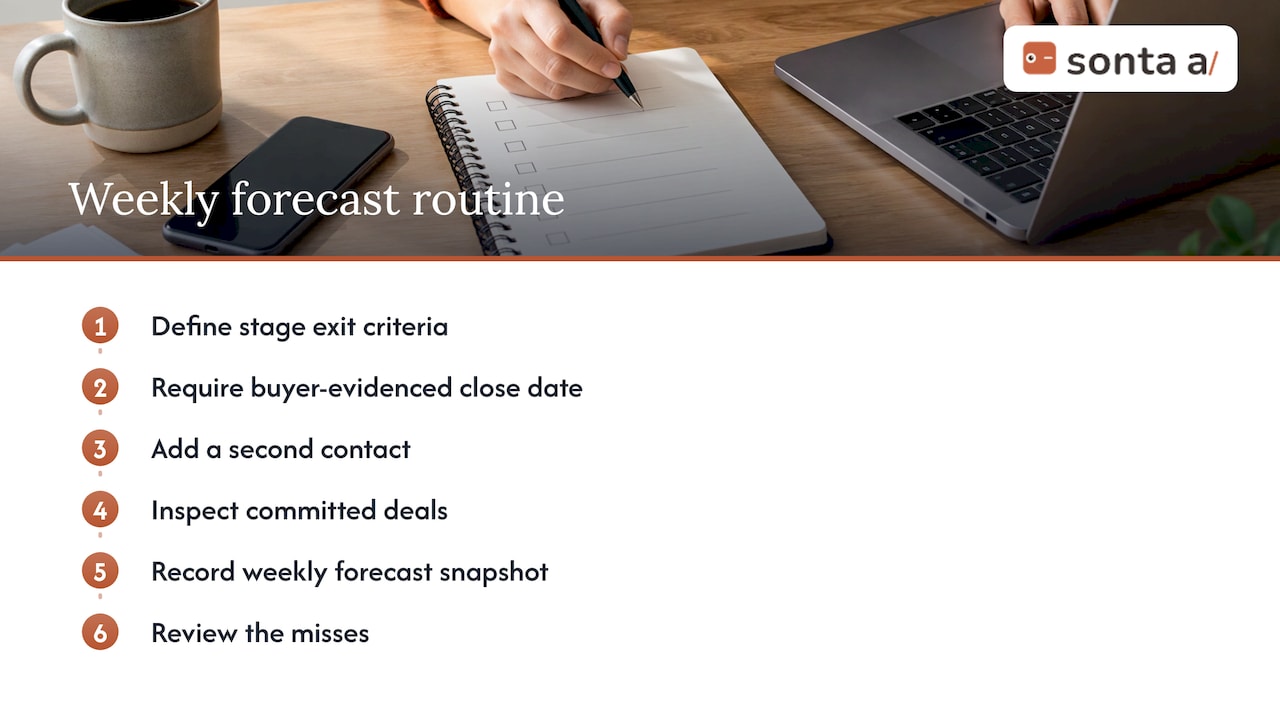
Step 1: Define exit criteria for each stage
Write what must be true before a deal moves forward. For example, a deal enters “proposal” only when the buyer has confirmed budget and named a decision-maker. Keep each criterion checkable.
Where it goes wrong: criteria that rely on opinion, such as “good conversation”. If two people could disagree on whether it happened, it is not a criterion.
Step 2: Require a buyer-evidenced close date
A close date should come from something the buyer did or said. A signed-off budget cycle, a board date, a contract renewal. A date the seller picked to fill the quarter is a hope.
Where it goes wrong: dates that slide by a month every time the deal is reviewed. Flag any deal whose close date has moved twice.
Step 3: Add a second contact
Single-threaded deals die when one person leaves, changes priorities or goes quiet. Ask for a second named contact before a deal counts as committed.
Sonta’s Signal Agent watches public LinkedIn activity for moments such as a new decision-maker at an account or a contact changing jobs. It shows each reason with a link, so you can check it. A job change or a hiring post is a reason to talk. It is not buying intent. Still, knowing that your champion has moved on is exactly the news a forecast review needs.
Step 4: Inspect committed deals one by one
For each deal in the commit number, ask three questions. What changed since last week? What is the next step and its date? Who else is involved? A deal with no answer to the first question is stale.
We-Enable draws on Hyndman and Athanasopoulos’s work on judgmental forecasting. Asking a forecaster to document and justify a call creates accountability that can reduce bias. So write the reason down, not just the number.
Step 5: Record the forecast in one place, every week
Save a snapshot at the same time each week. Never overwrite it. At the end of the period, compare each snapshot with the actual result. This gives you accuracy by horizon, plus bias by person or deal type.
If you use Pipedrive, a Pipedrive CRM review is a useful way to check how its deal views and reporting fit this kind of routine. HubSpot users can run the same routine with deal properties and saved reports.
Step 6: Review the misses
After each period, list the five biggest gaps between forecast and result. For each one, name the cause: stale data, wrong stage, late buyer decision or seller optimism. Patterns appear within two or three periods.
Abertay’s Ben Nancholas argues that improvement must be grounded in strong sales leadership. Forecasting accountability, he says, is reinforced by regular meetings, inspections and adjustments. He also suggests treating the forecasting plan as business-critical, covering the calculation method, review milestones and ways to break existing patterns, such as skip-level forecasting.
Fix the data first
A routine only works if the data it inspects is current. Most sales teams spend time they do not have on updating records. When they skip it, the forecast drifts.
This is the problem Sonta is built around. It is an agentic CRM that finds opportunities and moves them forward. The CRM keeps itself up to date. AI agents research prospects, follow up, prepare meeting briefs and keep records current. The customer decides which steps need their approval.
For a forecast, that has three practical effects.
- Fresher records. Activity is captured as it happens, so the weekly review starts from what is true now.
- Evidence on each opportunity. Every opportunity shows what happened and a link to check it. Fit and intent are scored separately, so a good-fit account that has shown no sign of interest is not mistaken for a ready deal.
- Less busywork. Reps spend less time on updates and more on the clients and deals in front of them.
We cover the mechanics in our guides on sales pipeline automation for forecasts and real-time CRM insights. Our pipeline hygiene checklist lists what to verify on every deal before it enters the commit number.
Using your own reports
Whatever CRM you use, build one pipeline report by stage and one forecast-versus-actual view. In Sonta, the pipeline stage report shows where deals sit by stage. Pair it with the snapshots from your weekly review.
Compare options fairly
Teams improve forecasts in different ways. Each has real strengths.
| Approach | Strength | What it needs from you |
|---|---|---|
| Spreadsheets | Flexible, cheap to start, easy to share | Manual updates and version control |
| HubSpot | Mature reporting and a large ecosystem | Clean properties and agreed stage rules |
| Pipedrive | Simple visual pipeline, quick to adopt | Discipline on deal updates |
| Attio | Flexible data model | Setup time to fit your process |
| AI SDR tools such as Artisan and 11x | Automate outbound prospecting | A CRM and process around them |
| Sonta AI | CRM, email sequences, LinkedIn outreach and signals in one app | Approval rules you set for agents |
An AI SDR is one agent that stops at the meeting. Sonta has an agent for every step and is the CRM too. That matters for forecasting because the record of what happened stays in one place.
If your team is on HubSpot or Pipedrive today, the routine above works there. Your current CRM is not the problem. The gap is usually in how current the data is and how the review runs.
What Sonta replaces and what it costs
Sonta replaces a CRM, an email sequencer, a LinkedIn outreach tool and a signal tool in one app. Sonta’s value calculator found a median 36% less than the cheapest equivalent stack (Sonta value calculator, list prices read 17-18 Oct 2026).
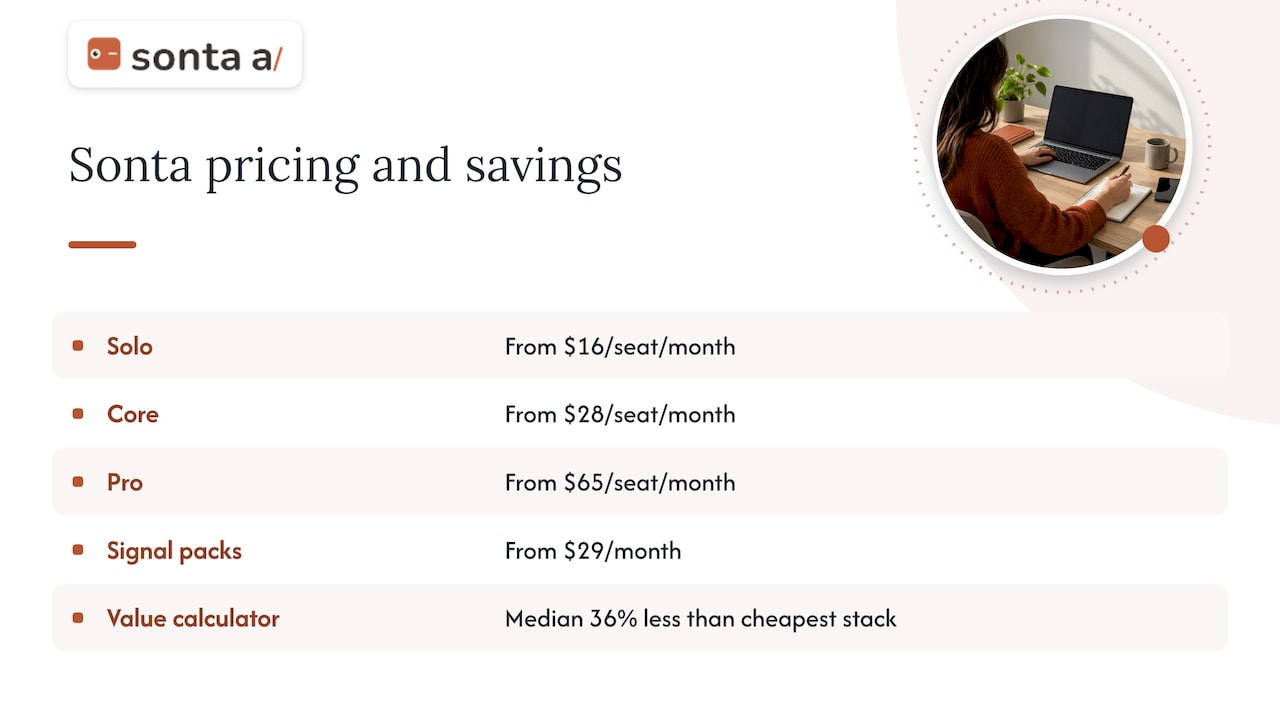
Plans are billed per seat. Solo starts from $16 a month, Core from $28 and Pro from $65. Signal packs start from $29 a month. Email sequences are unlimited. LinkedIn accounts are billed per seat.
Customers run AI on their own keys: Anthropic, OpenAI, Google or OpenRouter. There is no markup on AI when you use your own keys. You can also use Sonta from Claude or ChatGPT through its MCP server, under the same rules and approvals. Data is stored in the EU under GDPR.
Our view on forecasting
We think most forecast problems are record problems. The formula is easy. Keeping a deal record true for ninety days is hard.
Teams that miss usually have a good process on paper. What fails is the data underneath it. Notes go in late. Contacts change jobs and nobody notices. Stages move because someone was optimistic on a Friday.
That is why we built a CRM that finds opportunities and moves them forward. The records update as work happens. Each opportunity shows its reason and a link, so a manager can check it in seconds. Fit and intent are scored separately, so a forecast does not rest on one blended number nobody can explain.
We run our own sales on Sonta. We also keep the customer in charge. You decide which steps need your approval, and the same rules hold when you use Sonta from Claude or ChatGPT.
A forecast is a promise about the future made from the evidence you have today. Better evidence makes a better promise.
Pavel
Try it on your own pipeline
If your weekly review spends more time fixing records than judging deals, start with the records. Sonta is an agentic CRM that finds opportunities and moves them forward, with the CRM, sequences, LinkedIn outreach and signals in one app. See the plans and prices or the Agentic CRM.
A note on outreach. LinkedIn has its own rules on automation, so check them before you set up any LinkedIn activity. Business email also needs prior consent before first contact in Germany, the Netherlands, Denmark and Poland. In South Africa, POPIA applies to first-contact rules. Sonta lets you choose which steps need approval, which helps you keep those rules in view.
Book a demo and leave with your first leads.
FAQ
What is the formula for sales forecast accuracy?
Subtract the forecast from actual revenue and take the absolute value. Divide by actual revenue and multiply by 100 to get the absolute percentage error. Accuracy is 100% minus that number, as We-Enable explains. Average the errors over several periods to get MAPE.
How often should we measure it?
Measure it every period you forecast, usually monthly and quarterly. Save a snapshot of the forecast at a fixed date and score that version. Review the misses in the same meeting so the lesson is fresh.
How do I improve sales forecast accuracy fast?
Start with three changes. Define exit criteria for each stage, require a buyer-evidenced close date and add a second contact to every committed deal. Then run a weekly review of 30 to 45 minutes and record the forecast in one place. Most teams see the pattern of their misses within two or three periods.
Does forecast accuracy matter for a small, founder-led firm?
Yes. A founder who sells also plans hiring, cash and delivery capacity from the forecast. KPI Tree notes that forecasts support hiring, capacity, expenditure and board confidence. With few deals, one slipped engagement moves the number a lot, so current records and clear close dates matter even more.
Do we need to change CRM to forecast better?
Not necessarily. The routine works on HubSpot, Pipedrive or a spreadsheet. The question is whether your records stay current without manual effort. If they do not, a CRM that updates itself removes the main cause of drift.
Sources
- Sales Forecasting: Why It’s Inaccurate and How to Fix It, Abertay University (October 2023)
- How to Improve Sales Forecast Accuracy, We-Enable (2026)
- Forecast Accuracy: Definition, Formula and How to Improve It, KPI Tree
- Sales Forecast Accuracy: 85% and 22% Are One Team, Ivri Tech (August 2026)