Sales Capacity Planning: How to Build a Model That Holds

Sales capacity planning tells you how much your team can realistically sell in a period, so you can compare it with the target and decide whether to hire, when and how many. The core formula is simple: ramped reps multiplied by quota multiplied by expected attainment. The model only holds if you adjust for ramp time, attrition and pipeline, and if you feed it with CRM data you trust.
This guide is for sales leaders and founders at UK and European agencies, consultancies, IT services and software firms. It walks through the formula, the inputs, a worked example and the hire-or-improve decision.
TL;DR
- Capacity is ramped reps × quota × attainment. Then adjust for ramp, attrition, leave and pipeline.
- Use the median attainment of your own reps, not the best quarter and not the quota.
- Ramp time is the assumption that moves the answer most. Take it from past hiring cohorts, not the onboarding deck.
- If the team cannot hit target even at full attainment, hire. If it can with better output, fix output first.
- Capacity only counts if reps have enough qualified pipeline to work. Plan the pipeline with the headcount.
Table of Contents
- What sales capacity planning is
- The formula, and why the simple version misleads
- The inputs your model needs
- A worked example
- Build the model in five steps
- Hire, or raise output first?
- Where time goes: the selling hours you can recover
- How often to review the plan
- Our perspective
- Sonta AI for the pipeline side of the plan
- Compliance when you add outreach capacity
- How the alternatives compare for the pipeline side
- FAQ
- Sources
What sales capacity planning is
Sales capacity planning is a modelling process. It sets the upper and lower limits of what your team can deliver and acts as a bridge between the target and reality. Pigment describes it as comparing expected capacity (the current team structure, minus expected attrition) with the revenue target. A capacity gap exists when the target is larger than the team’s potential productivity. The answer is to hire more sellers, raise productivity, or both.
Wall Street Prep frames it as a predictive model. Management tries to improve revenue growth while making efficient hiring decisions, based on estimated rep performance. The model also gives you a ceiling on the revenue the team can produce.
For a small firm the idea is the same, only the numbers are smaller. If three people sell and the founder sells too, you still need to know how many deals those people can close in twelve months. You also need to know what happens to that number if one of them leaves in June.
The formula, and why the simple version misleads
The standard version is: sales capacity = number of reps × (quota per rep × quota attainment). Abacum’s example uses a $10M target, a $1M quota per rep and 80% attainment. That gives 13 reps.
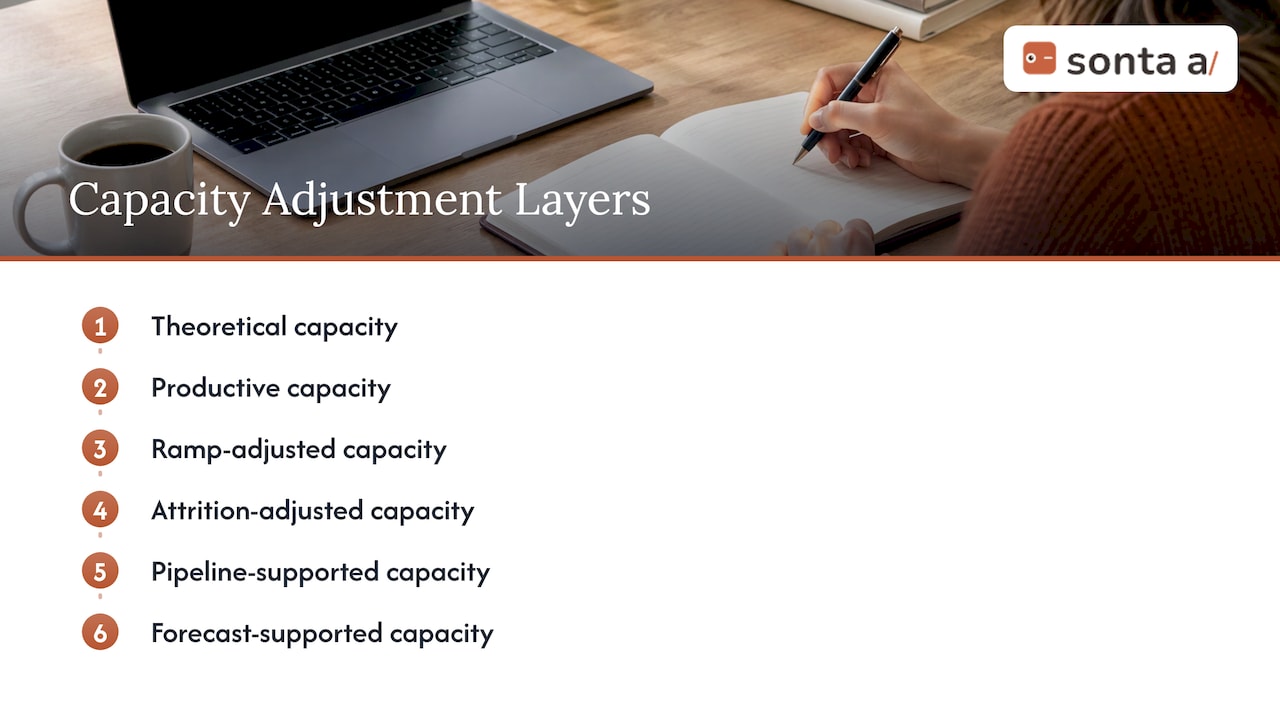
The simple version overstates what you have. It treats every rep as fully ramped and every seat as permanently filled. Rework separates several layers: theoretical, productive, ramp-adjusted, attrition-adjusted, pipeline-supported and forecast-supported capacity. Each layer takes something away from the number above it.
The gap can be large. ORM’s example targets $40M of new business with a $1.0M quota and 75% median attainment. Each rep then contributes $750K, which means 53.3 fully ramped reps. After adding 6 for ramp and 4 for attrition the plan needs 63 people, against 40 from the naive calculation. ORM’s point is that the plan goes wrong in the planning room, months before anyone misses a number.
The inputs your model needs
Keep the input list short and make every line traceable to data.
Quota and attainment
Quota is the target for a productive rep in a segment. Attainment is the share of quota a fully ramped rep actually delivers. ORM advises pulling the prior four to six quarters and using the median, not the top quartile.
One published benchmark gives a sense of the spread. Pulse RevOps reports Pavilion 2026 SaaS median attainment of 72%, with 88% at the top quartile and 58% at the bottom. Your own figure matters more than any benchmark. Use the benchmark only to sanity-check it.
Ramp time
Ramp is the number of months from hire to full productivity. HiBob calls it the most critical assumption driver. It recommends normalising every rep to a common start point, studying historical ramp rates and excluding outliers. It advises against a default 25, 50, 75 and 100% quarterly ramp.
Ramp varies by role. The CRO Report’s table shows SDRs at 2 to 3 months, SMB account executives at 3 to 4, mid-market at 4 to 6 and enterprise at 6 to 9. It estimates that a mid-market account executive hired on 1 January contributes roughly 0.4 productive AE-years in the first year, and an enterprise one about 0.35.
For a UK view, Ell Advisory reports a 7-month ramp for field sales and a 136-day average manufacturing sales cycle, against 75 days in SaaS. Longer cycles mean slower ramps, because a new rep cannot close a nine-month deal in month four. Lative makes the same point and tells leaders to map productivity by month from what past cohorts did.
Attrition
Model attrition in two parts: voluntary exits and involuntary exits. ORM says involuntary exits are harder to predict but should not be set to zero. Each departure leaves a hole that takes the full ramp curve to refill.
The CRO Report puts B2B SaaS sales attrition at 20 to 30% a year. It gives a buffer formula: target productive headcount ÷ (1 − annual attrition rate) = starting headcount needed. Pulse RevOps puts the replacement lag from open role to ramp at 50% at typically 5 to 7 months.
These are SaaS figures. If your agency or consultancy has a stable team, use your own trailing 24-month departure rate. ORM suggests applying it to planned headcount and multiplying by the replacement cycle in quarters, to see the real capacity loss.
Pipeline coverage
Capacity only matters if sellers have qualified pipeline to work. Rework’s RevOps team notes that a fully staffed team with weak coverage will miss plan. This is the input most small firms leave out, and it is the one that most often decides the year.
A worked example
The numbers below are our own illustration for a small UK services firm. They are not benchmarks.
- New-business target for the year: £3,000,000
- Full quota per seller: £600,000
- Median attainment over the last six quarters: 75%
- Annual attrition assumed: 25%
Step one is productive capacity per ramped seller: £600,000 × 0.75 = £450,000.
Step two is the number of ramped sellers needed: £3,000,000 ÷ £450,000 = 6.7.
Step three is the attrition buffer, using the formula above: 6.7 ÷ (1 − 0.25) = 8.9 sellers at the start of the year.
Step four is the ramp adjustment. A seller hired on 1 January with a mid-market style ramp gives roughly 0.4 of a year of output. Two hires made in the same month would add about 0.8 productive years, not 2.
The result is not a headcount. It is a hiring calendar. Hires made in the first quarter pay back in the same year. Hires made in the third quarter mostly build next year’s capacity. That is the practical consequence ORM draws from ramp modelling.
| Step | Calculation | Result |
|---|---|---|
| Productive capacity per ramped seller | £600,000 × 75% | £450,000 |
| Ramped sellers needed | £3,000,000 ÷ £450,000 | 6.7 |
| Starting headcount with 25% attrition | 6.7 ÷ 0.75 | 8.9 |
| First-year output of one January hire | 0.4 AE-years (mid-market ramp) | £180,000 at full quota productivity |
Build the model in five steps
- Pull the data. From your CRM take bookings, deal counts, contract values, stages, average deal size and sales cycle. From HR take each seller’s start date, role changes and segment. HiBob notes that the more structured the CRM, the stronger the model.
- Set the drivers. Quota, median attainment, ramp curve, attrition. Keep each segment separate, as Lative recommends for attainment.
- Run scenarios. Finance teams often model 80, 100 and 120% attainment. Do the same and see how much the hiring plan moves.
- Compare with the target. If the target exceeds capacity, you have a gap. Size it in revenue and in sellers.
- Add the pipeline test. For each seller, check that the pipeline you can create supports their quota at your normal win rate.
The model does not need to be perfect. Rework’s view is that it should expose its assumptions clearly enough for sales, finance and leadership to argue about the right things.
Hire, or raise output first?
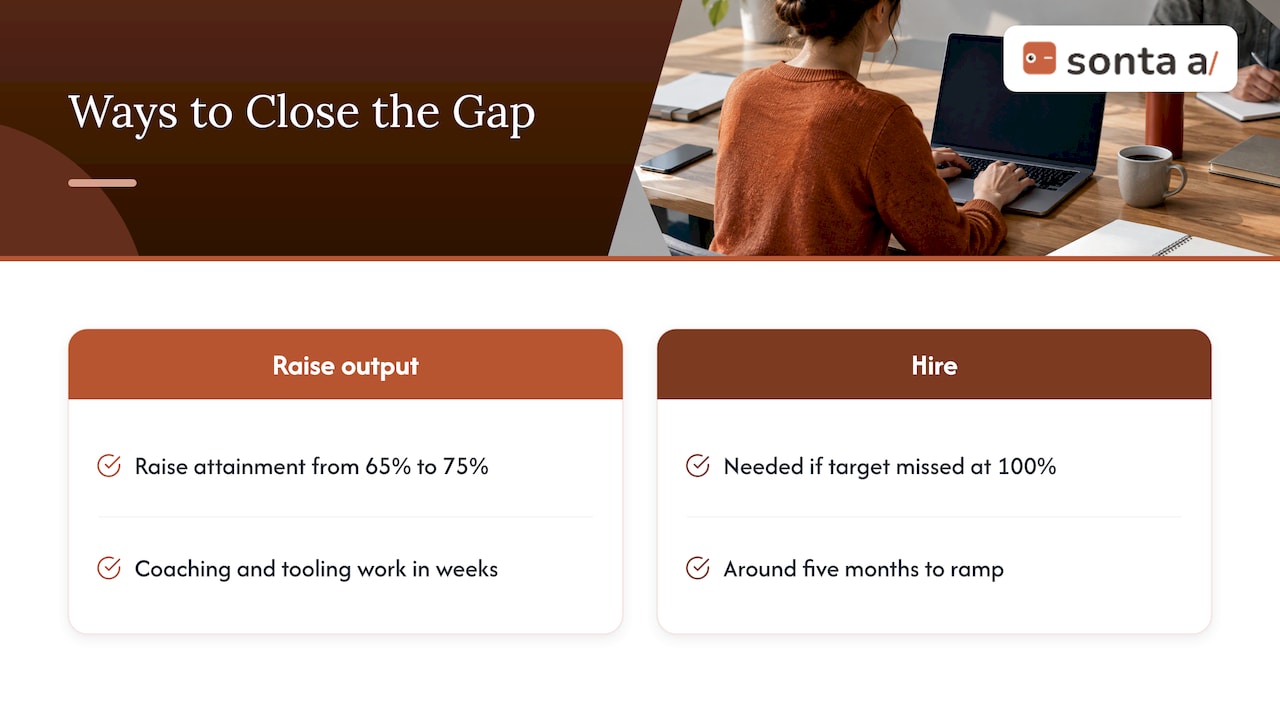
The gap tells you how much. It does not tell you how to close it. RepMath’s rule is useful here. If the team could hit target by lifting attainment from 65% to 75%, hiring is not the most urgent lever. Coaching, process and tooling work in weeks, while a hire takes around five months to ramp. If the team cannot hit target even at 100% attainment, hiring is structurally necessary.
Ell Advisory argues the same way for UK manufacturers. It reports that a field rep costs about £107k fully loaded in year one, and that 35% of field-sales hires leave before quota. It also reports that reps spend only 28% of the week selling. Its modelled alternative is to improve four levers by 10% each: opportunities, deal value, win rate and cycle length. Ell estimates that lifts revenue per day by about 46%. Treat that as one adviser’s model for one sector, and run your own numbers.
Where hiring is the answer, plan the calendar and the recruitment route together. Some firms use recruitment process outsourcing to shorten the open-role-to-start lag, which is the part of replacement time you can influence.
Where time goes: the selling hours you can recover
Capacity is not only headcount. It is also the share of the week each person spends on selling. Reps lose hours to research, data entry, chasing replies, booking meetings and preparing for calls. In an owner-led firm the founder loses the same hours to delivery work.
That is why the productivity side of the model matters. If admin takes 20% of a seller’s week and you halve it, you have added capacity without a hire and without a ramp. The effect shows up in the model as higher attainment or more opportunities per seller.
Two practical checks help:
- Time audit. Ask each seller to log a typical week for two weeks. Split the hours into selling, preparing, admin and internal work.
- Record freshness. If deals sit in the wrong stage, your model is wrong too. Stale records distort attainment, cycle length and pipeline coverage.
Our guides on AI pipeline management and sales pipeline automation cover how to keep those records current. Our guide to sales process mapping shows how to find the steps that cost the most time.
How often to review the plan
Review the plan every quarter. Varicent recommends quarterly reviews of territory design and coverage, pipeline mix and deal velocity by segment, ramp assumptions against actual results, and the spread of productivity across the team.
Track these against the plan:
- Attainment by segment, against the median you assumed
- Actual ramp of each new hire, against the curve
- Departures and time to replace
- Pipeline coverage per seller
- Sales cycle length
When actuals drift, change the assumption, not the story.
Our perspective
Most capacity plans fail on the input side. The formula is fine. The CRM data behind it is out of date, and the pipeline behind the headcount is thin.
We built Sonta AI as an agentic CRM that finds opportunities and moves them forward. For a sales leader, that matters in two places in the capacity model. The first is pipeline. The Signal Agent watches public LinkedIn activity, such as a recommendation request, a new decision-maker, a company hiring or a contact changing jobs. It shows each reason with a link, so a seller can check it. A job change or a hiring post is a reason to talk. We never treat it as buying intent. Fit and intent are scored separately, so reps start with the right conversations.
The second is selling time. Agents research prospects, follow up, prepare meeting briefs and keep records current. The customer decides which steps need approval. Sequences are native and written from the moment a signal fires. Email sequences are unlimited.
We run our own sales on Sonta. We do not promise meetings, customers or revenue. We do think a team that spends less of its week on busywork has more room in its capacity plan, and cleaner records make every assumption in the model easier to trust.
Pavel
Sonta AI for the pipeline side of the plan
If your team is on HubSpot or Pipedrive and the model shows a pipeline gap, you can see how Sonta fills it in a demo. Sonta replaces a CRM, an email sequencer, a LinkedIn outreach tool and a signal tool in one app. Across the stack the median saving is 36% (Sonta value calculator, list prices read 17-18 Oct 2026).
Plans start from 16 USD per month per seat for Solo, 28 USD for Core and 65 USD for Pro. Signal packs start from $29 a month. LinkedIn accounts are billed per seat. Customers run AI on their own keys, from Anthropic, OpenAI, Google or OpenRouter, and there is no markup on AI. Data is stored in the EU under GDPR. Compare the Sonta plans and prices or see the agentic CRM.
Compliance when you add outreach capacity
More outreach capacity brings rules. Check them before you scale.
- UK. The ICO’s business-to-business marketing guidance says you must identify yourself and offer a valid way to opt out. It also says to keep a suppression list. Sole traders and some partnerships are treated differently from companies, so check who you are writing to.
- Germany, the Netherlands, Denmark and Poland. Business email needs prior consent before first contact. Take local advice before you run campaigns there.
- South Africa. POPIA applies to first-contact rules.
- LinkedIn. Automation is governed by LinkedIn’s own rules, and accounts can be restricted. We do not describe any LinkedIn automation as safe or undetectable. Read the current terms before you run it.
How the alternatives compare for the pipeline side
Buyers consider several routes. Each has real strengths.
| Option | Strength | Where it stops |
|---|---|---|
| HubSpot or Pipedrive | Familiar, widely used CRMs with large ecosystems | Sequencing, LinkedIn outreach and signals usually come from other tools |
| Attio | Flexible, modern data model | Outreach and signal tools sit alongside it |
| Gojiberry AI | Focused on LinkedIn-based lead signals | It is a signal tool, not a CRM |
| HeyReach | Built for LinkedIn outreach at volume | LinkedIn only |
| Instantly | Strong at email sending | Email only |
| AI SDR tools such as Artisan and 11x | One agent handling outreach | An AI SDR is one agent that stops at the meeting |
| Spreadsheets | Free and flexible | Records go stale as the team grows |
| Lead-generation agency | Capacity without hiring | Your records and process sit outside your CRM |
| Hiring a salesperson | Judgement and relationships | Ramp time, cost and attrition risk, as the model above shows |
Sonta has an agent for every step and is the CRM too. Your current CRM is not the problem. Many teams keep their process and cut the number of tools around it.
FAQ
What is capacity planning in sales?
It is the process of working out how much your team can realistically sell in a period and comparing that with the target. The result tells you whether to hire, when and how many. It uses quota, attainment, ramp time, attrition and pipeline coverage.
How do you build a sales capacity model?
Pull bookings and pipeline data from your CRM and headcount data from HR. Set quota, median attainment, ramp curve and attrition by segment. Then calculate capacity, compare it with the target and test the pipeline behind it. Review it every quarter.
What is an example of sales capacity planning?
With a £3,000,000 target, a £600,000 quota and 75% attainment, each seller produces £450,000. That means 6.7 ramped sellers. With 25% attrition you need 8.9 at the start of the year. The figures are our illustration.
Should I hire or improve productivity first?
Check the gap at 100% attainment. If the team can hit target with better attainment, work on coaching, process and tooling first. If it cannot, hiring is necessary. Plan the hires early, because a new seller takes months to ramp.
Sources
- Step-by-Step Guide to Sales Capacity Planning, Pigment
- Sales Capacity Planning, Formula and Calculator, Wall Street Prep
- Sales Capacity Planning: 5-Step Process, Abacum
- Sales Capacity Planning, Rework
- How Many Sales Reps Do I Need, ORM
- How to Build a Sales Capacity Plan from Scratch, ORM
- Sales capacity planning and modeling guide, HiBob
- Capacity-planning models for SaaS sales teams, Pulse RevOps
- Sales Hiring Plan, CRO Report
- Sales Capacity Planning for Manufacturers, Ell Advisory
- How to Build a Sales Capacity Plan, Lative
- Sales Headcount Calculator, RepMath
- Sales Forecast Accuracy with Capacity Planning, Varicent
- Business-to-business marketing, ICO
- Recruitment Process Outsourcing guide