Real-Time CRM Reporting: How It Works and How to Trust It

Real-time CRM reporting means your dashboards and reports reflect a change in a record (a deal stage moved, an email was opened, a form was submitted) within seconds or a few minutes, instead of waiting for a nightly refresh or a rep to update a field. How close to “live” you get depends on how data reaches the report (event-based push, short-interval polling or scheduled batch), and how much you can trust it depends on the quality of the records underneath. This guide covers the mechanics, the reports worth building first, the data practices that keep them accurate, and how to set the whole thing up around your own goals.
TL;DR
- Real-time reporting is a pipeline, not a switch: event-based updates arrive in seconds, polling in roughly 1 to 15 minutes, and batch jobs in hours to a day.
- Start with six report types: pipeline, conversion, activity, forecast vs actual, won/lost and sales cycle.
- A live dashboard built on stale, incomplete or inconsistent records only shows wrong numbers faster, so enforce required fields, stage rules and shared metric definitions.
- Assign a freshness target to each critical field, monitor sync health, and reconcile automated reports against an authoritative count.
- The strongest fix for the root problem is capturing data automatically rather than relying on manual entry.
Table of Contents
- What real-time CRM reporting actually is
- The reports worth building first
- How real-time reports help with follow-ups and sales process
- Setting up real-time reports around your goals
- Integrations and data practices that keep reports accurate
- Why real-time reports can mislead, and how to fix it
- Keeping the data clean at the source
- Measuring what live reporting is worth
- Our perspective
- See your own reporting gaps in 30 minutes
- FAQ
- Sources
What real-time CRM reporting actually is
A CRM report is a query over records. It becomes “real time” when the path from a change in a record to the number on a screen is short enough that nobody acts on stale information. That path has three common shapes.
Event-based. The CRM emits an event when a record changes (through change-data-capture, platform events or webhooks) and the dashboard updates when it arrives. One practitioner guide to real-time sales dashboards says updates typically arrive within seconds in this model.
Polling or near-real-time. A connector asks the CRM for changes on a short fixed schedule, for example every 1 to 15 minutes. The same source describes this as effectively indistinguishable from true real time for most sales use cases, which matches how sales managers actually use dashboards: nobody needs a pipeline total accurate to the second.
Scheduled batch. Data is extracted and refreshed hourly or daily. This is fine for board-level trend reports and poor for anything a rep or manager acts on during the day.
At the enterprise end, one architecture guide describes CRM data pushed through streaming or webhooks into a message broker such as Kinesis or Kafka, then fanned out to dashboards and other analytics. Most sales teams do not need that machinery. They need to know which of their metrics belong in which freshness tier, and to pick a CRM whose reporting layer reads from the same live records the team works in.
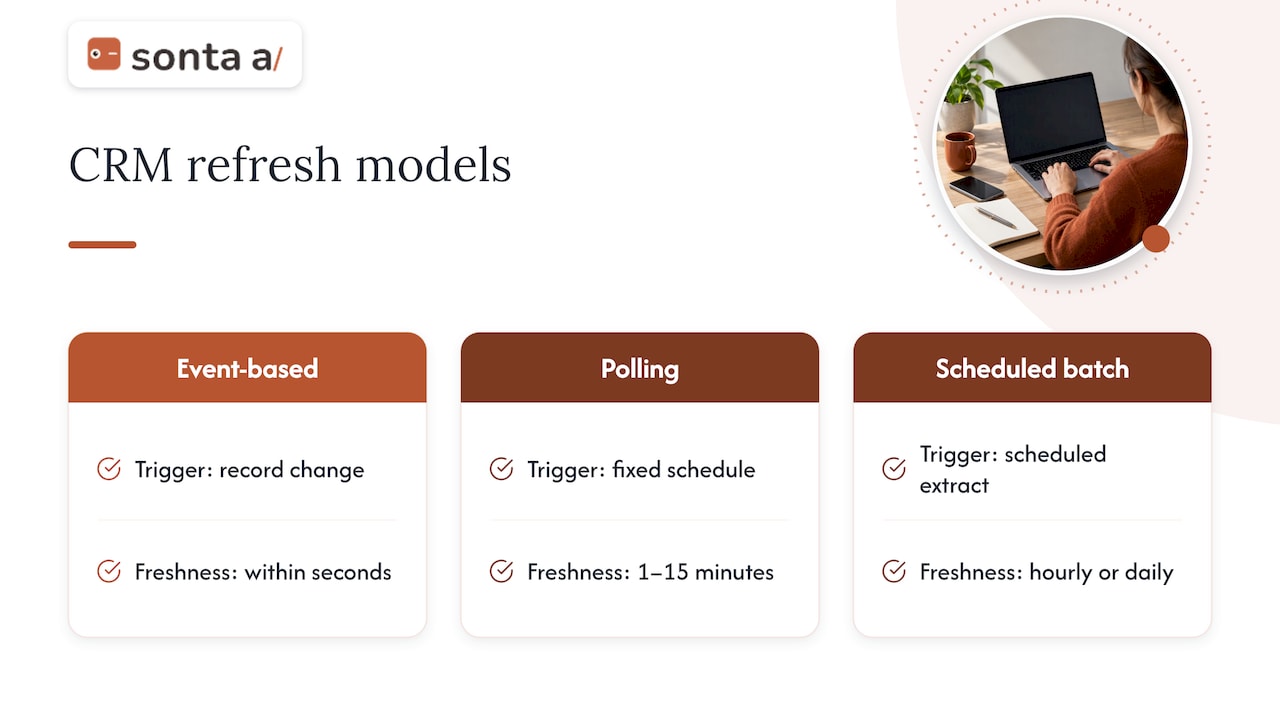
When it is configured well, the CRM’s own event engine logs a change and refreshes the affected report, so dashboards update when a deal stage changes, an email is opened or a form is submitted. The word that matters in that sentence is “when it is configured well”, and the rest of this article is about what that takes.
The reports worth building first
Before tuning latency, decide what the dashboard is for. A practitioner guide to sales reporting lists six core report types and the metric each one centers on. They cover the questions most sales leaders ask every week.
| Report | Core metric | Question it answers | Useful freshness |
|---|---|---|---|
| Pipeline | Coverage ratio | Is there enough open pipeline to hit target? | Minutes to hourly |
| Conversion | Stage-to-stage % | Where do deals stall or drop out? | Hourly to daily |
| Activity | Calls, meetings, emails | Is the team doing the work that creates pipeline? | Minutes |
| Forecast vs actual | Variance % | How far is the forecast from reality? | Daily |
| Won/lost analysis | Win rate by reason | Why do we win and lose? | Daily to weekly |
| Sales cycle | Days to close | How long does a deal take at each size and segment? | Daily to weekly |
The last column is our own suggested starting point, not a standard. The principle is to give event-based or polling freshness to the metrics that trigger an action (a new lead needs a reply, a deal has gone quiet, a meeting was booked) and to let retrospective analysis run on slower schedules.
For benchmarks, the same guide puts healthy B2B SaaS opportunity conversion rates at 20 to 30%. Treat that as a reference point, because your own rate depends on how you define an opportunity and on your segment.
Pipeline stage reporting
The pipeline report is the one most teams build first and the one most damaged by loose stage definitions. If “Qualified” means three different things to three reps, a live dashboard simply shows three different realities in real time. A concise overview of how pipeline stages are defined and tracked shows why each stage needs entry criteria that can be checked, not a feeling. In Sonta AI, the pipeline stage report reads from the same records the team works in, so a stage change is visible in the report as soon as it is made.
How real-time reports help with follow-ups and sales process
The practical payoff of live reporting is behavioral. Reports that refresh within minutes let managers and reps act on three kinds of signals during the working day:
- Speed to respond. A new inbound lead with no logged activity is visible as an exception while it is still warm, rather than in tomorrow’s report.
- Stalled deals. A filter such as “open deals with no activity in seven days” turns the pipeline view into a daily follow-up list.
- Process leaks. A conversion report that updates continuously shows a stage where deals pile up, so you can fix the handoff in the same week it starts to hurt.
There is also a time argument. A Forrester Total Economic Impact study of the Riva platform cites a Forrester finding that 28% of the average sales representative’s work time goes to administrative tasks. The more of that work a CRM absorbs, by capturing activity and updating records itself, the more of the live dashboard reflects what reps actually did instead of what they remembered to log. That study concerns a different product, and we cite it only for the admin-time figure.
For a deeper look at the process side, see our write-up on real-time sales insights and on sales process automation.
Setting up real-time reports around your goals
Work through the setup in this order. Skipping to the dashboard first is the most common reason live reporting disappoints.
1. Start from decisions, not charts
Write down the five or six decisions someone makes weekly or daily: who to call, which deals to review, whether to hire, whether the quarter is on track. Each report should map to one of them. A chart that supports no decision is clutter, however live it is.
2. Tier each metric by freshness
The same practitioner source advises deciding before you build which metrics are event-based (seconds), polling (1 to 15 minutes) or batch (hours to a day), because the data source path determines the achievable freshness. Sort your list accordingly:
- Seconds or minutes: new lead assignment, meeting booked, reply received, deal stage change.
- Hourly: open pipeline value, activity counts by rep.
- Daily: forecast variance, sales cycle, win rate.
3. Choose the reporting periods
Live data still needs a window. Decide whether each report measures today, the week to date, the month or the quarter, and fix the cut-off time and time zone. A report that mixes a rolling seven-day window with a calendar month will never reconcile with the one next to it.
4. Map the data sources
List every system that writes to the records you report on: forms, email, calendar, calling, enrichment, billing. For each, note how a change arrives (push, poll or batch) and who owns it. This map is also your troubleshooting guide later.
5. Build, then document
Build the dashboards, write the definition of each metric next to it, and name an owner. Our academy walks through building a dashboard and the wider reports and dashboards model step by step.
Integrations and data practices that keep reports accurate
A dashboard is only as current as the weakest link feeding it. One integration guide describes reporting mismatches where systems are almost never looking at the same picture because their sync timing differs, and lists sync timing, partial syncs, schema mismatches, identity-resolution problems and inconsistent metric definitions as the main root causes.
From that and related guidance, a short checklist emerges:
- Move report-critical fields to real-time or trigger-based sync, and align batch windows to your reporting cut-offs.
- Map fields and allowed values explicitly, keep a shared data dictionary, and test mappings end to end.
- Monitor sync health for failed jobs and rate-limit errors, not only for successful runs.
- Measure the whole latency chain. A sales reporting automation guide points out that source commit delay, extraction, transport, transformation and refresh all add time, so a connector that runs hourly does not guarantee a tile reflects a change within the hour.
Watch for silent failures
The worst sync problems are the ones nobody sees. Call Logic notes that a common cause of silent sync failure is a mismatch between the data format a sequencing tool sends and the format the CRM expects. When the CRM rejects a record on a validation error, it typically sends no alert and the activity is never logged. Your activity report then shows a quiet rep who was in fact busy. Build an exception count (records rejected per day, per integration) into your monitoring so this surfaces on its own.
Deduplicate before you enrich
Duplicate contacts and companies split activity across records and distort every count. Run dedupe and field mapping before enrichment, as we describe in our guide to sales data enrichment for RevOps, and review the integration surface in the integrations overview. If you hit a unique-field conflict, our note on a duplicate value on a unique field explains what is happening.
Why real-time reports can mislead, and how to fix it
Speed is not accuracy. A sales reporting build guide puts it bluntly: when the underlying records are inaccurate, incomplete or outdated, even a sophisticated dashboard reflects bad inputs. Another automation guide makes the sharper point that a dashboard that updates automatically but calculates the wrong population is not successful automation, only faster error.
The common failure modes, and the control that addresses each:
| Failure mode | What you see | Control |
|---|---|---|
| Missing or late data entry | Pipeline looks thin, activity looks low | Capture activity automatically; required fields on stage change |
| Stage skipping or stale close dates | Forecast swings, cycle time looks too short | Stage progression rules; close-date update cadence |
| Inconsistent definitions | Two reports disagree on “pipeline” | Written metric definitions with one owner each |
| Duplicates and identity gaps | Counts inflated, activity split | Dedupe first, unique keys, matching rules |
| Sync delays or partial syncs | Numbers differ between systems | Freshness targets, sync health alerts |
| Attribution differences | Web analytics leads do not match CRM stages | Explain the gap instead of forcing a match |
The first three rows come down to configuration and management accountability: the build guide recommends mandatory fields, stage progression rules and close-date updating cadences, enforced in the CRM and backed by management follow-through. Our CRM data governance scan covers the same ground in a 30-minute format.
On the last row, a guide to reconciling web analytics with CRM data notes that leads and CRM stages rarely match because of attribution differences, identity stitching, duplicates, time lags, privacy limits and offline updates, and recommends explaining the gap rather than chasing a perfect match.
Reconcile on a schedule
Automation guidance recommends comparing the automated report with an authoritative count or value using the same cut-off, population, filters, currency, time zone and grain, then tracking the variance. Do this weekly at first. Once the variance stays small for a month, move to a monthly check. A simple mismatch between a dashboard and a raw record count is usually the first sign that a filter or a sync has drifted.
Set freshness targets per field
Tracking freshness only at whole-table level hides problems. A data observability article recommends a freshness target per critical field, such as lead score or opportunity amount, with an alert when the data goes stale. Pair that with completeness and uniqueness checks so quality drops are caught before a manager spots them in a meeting.
Be honest about latency
A snapshot at 9 AM can differ from one at 3 PM for the same record, and a data engineer’s notes on CRM extraction suggest dashboards should acknowledge their latency instead of implying real-time accuracy. A visible “last refreshed” timestamp on every dashboard is a cheap and effective way to do this.
If you need help tracing a number that does not move, see our troubleshooting note on a rollup that is not recalculating.
Keeping the data clean at the source
Every control above is easier when the data is captured correctly the first time. Teams that already run a disciplined first-party data program know the pattern: a clear plan for collecting and maintaining first-party data rests on consistent fields, owned definitions and regular cleanup, and the same applies to sales records. Reports can only be as consistent as the fields behind them.
To make that practical in a CRM:
- Limit free text. Use picklists with documented values for stage, source and loss reason.
- Make fields required at the stage where they become meaningful, not at record creation.
- Lock the filters on shared reports so a casual edit cannot change a metric.
- Review definitions quarterly, since a new product or segment often changes what “qualified” should mean.
Our concepts and data model guide and the page on configuring a record layout show how this looks in practice.
Measuring what live reporting is worth
Expect the return to show up in two places: time recovered from admin and better decisions from fresher information. The Forrester study mentioned above reports, for a composite organization using Riva, a 374% ROI, $1.7M net present value and 95,000 hours saved over three years. That is a modeled result for another product and will not transfer to your team, but it shows the kind of accounting worth doing: hours of manual entry removed, plus the revenue effect of faster follow-up. Our guide to measuring CRM automation ROI gives a framework you can apply to your own numbers.
Our perspective
Most real-time reporting projects start in the wrong place. Teams buy a faster dashboard, connect it to a CRM that depends on reps typing updates, and discover that the dashboard now shows the gaps in manual entry in real time. The manual data entry ceiling is the actual limit on reporting quality.
That is why we built Sonta AI around records that update themselves. Customizable AI agents handle routine sales work such as lead qualification, customer follow-up, account prep, scheduling and pipeline management, using models chosen per task, so the activity that feeds your reports is captured as it happens rather than reconstructed on Friday afternoon. We do not meter AI or automation usage, which means you can let the agents run across the whole pipeline instead of rationing them.
Our view is that reporting should be the visible surface of a well-governed system: agreed definitions, enforced stage rules, freshness targets per field and a reconciliation habit. Automate the capture, govern the definitions, and the live dashboard becomes something a manager can act on without a caveat.
Pavel
See your own reporting gaps in 30 minutes
If your dashboards are live but your team still argues about the numbers, the cause is usually in the capture and sync layer. Our AI Efficiency Diagnostic is a 30-minute session built to identify operational leakages and tune your tech stack, and it is a practical way to find which of your reports are fed by manual entry. Learn more on the AI Efficiency Diagnostic page, or see how Agentic CRM keeps records current on its own.

Plans are published on our pricing page: Solo from $16 per month per seat, Core from $28 per month per seat and Pro from $65 per month per seat, with Enterprise available on request. Migration and data modelling starts from $2,500 one-off for teams moving from another system.
FAQ
Is real-time CRM reporting truly instant?
Not always. Event-based setups update within seconds, while polling connectors refresh every 1 to 15 minutes and batch jobs run hourly or daily. For most sales decisions, a few minutes of delay is indistinguishable from live. What matters more is knowing each report’s refresh path and showing a last-refreshed time on the dashboard.
Which reports should I build first?
Begin with pipeline, conversion, activity, forecast vs actual, won/lost and sales cycle. Give the fastest refresh to activity and new-lead views, since those drive same-day action, and let the retrospective reports run daily. Add campaign or segment reports only after the core six are trusted.
Why do my CRM numbers not match another report?
Usually because of different definitions, cut-off times, time zones or filters, or because a sync is delayed or partial. Reconcile the two reports on the same population and period, calculate the variance, and document the metric definition. For web analytics comparisons, expect some permanent gap and explain it rather than forcing a match.
How do I stop bad data from reaching my dashboards?
Use required fields at the right stage, picklists instead of free text, stage progression rules and close-date update cadences. Add monitoring for rejected records and failed syncs, and automate activity capture so reporting does not depend on reps remembering to log work.
Sources
- Building a Real-Time Sales Dashboard, The Pearson Co.
- Real-Time CRM Analytics: A CXO’s Guide to Live Dashboards
- Maximize HubSpot Data Tools for Real-Time Monitoring, InsideA
- Sales Reporting: A Practitioner’s Guide, Prospeo
- 5 Root Causes of Reporting Gaps After Enterprise Integration
- Sales Reporting Automation: Platforms and Setup
- CRM Sync Problems That Hurt Outbound Sales Teams, Call Logic
- How to Build a Sales Reporting Dashboard, Cloudswitched
- Data Pipeline Observability for CRM, CRM Curator
- GA4 CRM Reconciliation Guide 2026
- The Total Economic Impact of Riva, Forrester
- Sales Pipeline Stages for Independent Car Dealers
- First-Party Data Strategy: A Practical Plan